The short answer
Barely, over the past year, and not over the longer run. Average hourly earnings rose 2.9% in the year to September 2026 (preliminary), just ahead of the CPI measure of rent (2.8%). Since September 2019, though, wages are up 33.2%, while CPI rent rose 34.9% and Zillow's asking rents 39.7%.
Key takeaways
The numbers side by side
The table compares September 2026 with the same month in 2025 and in 2019, so each change spans whole years of the same calendar month. The BLS series are not seasonally adjusted, and September 2026 wage figures are preliminary.
| Measure | Change over the year | Since September 2019 | Source |
|---|---|---|---|
| Average hourly earnings, all private employees (preliminary) | +2.9% | +33.2% | BLS |
| Average hourly earnings, production and nonsupervisory (preliminary) | +3.2% | +36.7% | BLS |
| CPI rent of primary residence | +2.8% | +34.9% | BLS |
| Zillow typical asking rent (ZORI) | +2.7% | +39.7% | Zillow |
| Median rent on new leases | −0.4% | Not shown | Apartment List |
| Consumer prices, all items | +3.7% | +31.2% | BLS |
Did wages or rents rise faster this year?
Wages, by a hair. Average hourly earnings of all private employees were $37.69 in September 2026 (preliminary), up from $36.62 a year earlier (+2.9%). For production and nonsupervisory workers the figure was $32.54, up 3.2%.
CPI rent of primary residence rose 2.8% over the same year. On new leases, Apartment List's national median was $1,388, 0.4% lower than a year earlier, while Zillow's typical asking rent was $1,932, up 2.7%.
Measured year over year, wage growth beat CPI rent growth in 10 of the last 11 months with data; the exception was June 2026. A separate BLS measure, the Employment Cost Index for private-industry wages and salaries, rose 3.1% in the year to Q2 2026.
Have rents outpaced wages since before the pandemic?
Yes, by both rent measures, though by very different amounts. From September 2019 to September 2026, average hourly earnings rose 33.2% (from $28.30). CPI rent rose 34.9%, and Zillow's typical asking rent rose 39.7%, from about $1,383 to $1,932.
The timing differs by measure. On a cumulative basis Zillow's asking rents pulled ahead of wages in June 2021, as asking-rent growth climbed toward a peak of around 15% a year in early 2022. CPI rent did not pass wages cumulatively until 2023, around the time its own growth peaked near 8.8%.
Faster yearly wage growth has not yet closed those cumulative gaps. Since March 2026, the gap between asking rents and wages widened from 4.3 to 6.5 percentage points, and the gap between CPI rent and wages from about 0.0 to 1.7 points.
Another way to see it: at the average hourly wage, a month of Zillow's typical asking rent took about 51.3 hours of pre-tax work in September 2026, against 48.9 hours in September 2019. That is a rough national illustration for one earner, not a measure of any household's budget.
Are wages keeping up with inflation?
Not over the past year. Consumer prices overall rose 3.7% in the year to September 2026, faster than average hourly earnings, so the average private-sector wage lost about 0.8% of buying power. For production and nonsupervisory workers the loss was about 0.5%.
Over the longer stretch wages are ahead of overall prices: since September 2019 average hourly earnings rose 33.2% while overall prices rose 31.2%. When other prices rise faster than pay, there is less room in a household budget for a rent increase, whatever rents themselves are doing.
What this means for renewal pricing
National wage growth is one reference point for a renewal, not a rule. Your local market and your own costs matter more. These are considerations, not recommendations.
- Benchmark, don't copy: this year's wage growth (2.9%) and CPI rent growth (2.8%) are reference points to compare with local listings and your expenses.
- Compare the raise with the cost of turnover. A vacant month, cleaning, repairs and leasing time can cost more than a small difference in rent; run your own numbers with the turnover and renewal calculators.
- Send the renewal offer early, with a clear figure, so the household has time to plan and you have time to market the unit if they leave.
- Check local notice and rent rules before sending an increase. They vary by state and city.
- Apply the same written criteria to every applicant and renewal, and follow applicable fair housing and local laws.
| Raise matched to | Growth | New monthly rent |
|---|---|---|
| Average hourly earnings | +2.9% | $1,544 |
| CPI rent of primary residence | +2.8% | $1,542 |
Methodology
We pull each BLS series from its official data page on data.bls.gov, Zillow's published ZORI file and Apartment List's national rent report with a script, and compute every change from those values. Series titles are confirmed on the same BLS pages.
Year-over-year changes compare the same month a year apart. Long-run changes use September 2019 as the base, the same calendar month as the latest data and before the pandemic. Cumulative gaps are the rent measure's percent change since the base minus the wage percent change, in percentage points. Real wage growth is the ratio of this year's to last year's average hourly earnings divided by the same ratio for all-items CPI, minus one. The renewal and hours-of-work figures are arithmetic illustrations.
Limitations
Read the comparison with these limits in mind.
- Average hourly earnings are gross, pre-tax pay for payroll jobs, not household income. BLS excludes employee benefits from the measure, and it leaves out the self-employed and the number of earners in a household.
- Averages can move when the mix of jobs changes, not only when pay changes. In April 2020, early in the pandemic, the year-over-year change jumped to 8.1%; a year later it was 0.6%.
- CPI rent samples rents paid by renter households, most of them on continuing leases, while Zillow and Apartment List measure asking or new-lease rents. They are shown side by side, not merged.
- BLS did not collect CPI data for October 2025 during the lapse in federal appropriations, so the monthly comparison has a gap there.
- The latest monthly wage figures are preliminary and are revised in later releases.
- National figures hide large local differences in both pay and rents.
- This page does not forecast wages or rents.
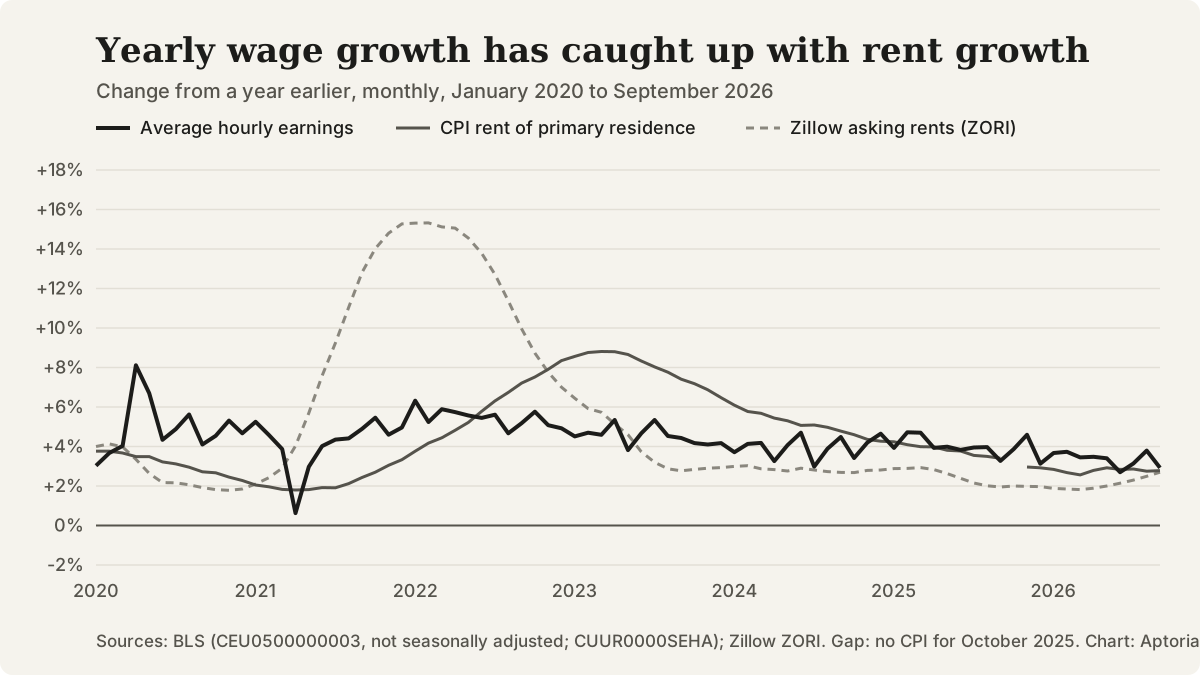
Year-over-year change in average hourly earnings, CPI rent and Zillow asking rents, January 2020 to September 2026. Sources: BLS, Zillow.
Questions that come up
What is average hourly earnings?
It is a monthly BLS estimate of pay per hour for private-sector payroll jobs, from the Current Employment Statistics survey. BLS excludes employee benefits from it.
Why do different rent measures disagree?
They measure different rents. CPI rent covers rents paid across renter households, while Apartment List measures new leases and Zillow measures typical asking rents. In September 2026 they ranged from −0.4% to +2.8% over the year.
How often does this data update?
BLS publishes average hourly earnings with the monthly jobs report and CPI each month; the Employment Cost Index is quarterly. Zillow and Apartment List update monthly.
Should I base my renewal increase on wage growth?
It is one useful reference, not a formula. Local comparable rents, your costs, the tenant's payment and lease history, and the cost of turnover all matter, along with local notice and rent rules.
Sources and references
Follow each source to check the underlying claim. Access checks and professional review are different steps.