The short answer
As of late October 2026 the U.S. housing market is slow, and borrowing has gotten more expensive. Freddie Mac's average 30-year fixed rate was 7.32% on October 22, 2026, up from 6.19% a year earlier. Existing homes sold at a 3.99 million annual pace in September, and the median price rose 1.3%. Rental vacancy is at its highest reading since 2017, and fewer new apartments are being finished.
Key takeaways
The key numbers
Each figure below is the most recent release we could retrieve on October 23, 2026. Dates differ because each publisher has its own schedule; the vacancy rate is quarterly and the mortgage rate is weekly.
| Measure | Latest | Change | As of | Source |
|---|---|---|---|---|
| 30-year fixed mortgage rate | 7.32% | 6.19% a year earlier | Week of October 22, 2026 | Freddie Mac |
| Median existing-home price | $417,500 | +1.3% year over year | September 2026 | NAR |
| Existing-home sales (annual pace) | 3.99 million | −2.2% year over year | September 2026 | NAR |
| Months' supply of homes for sale | 4.8 months | 4.5 a year earlier | September 2026 | NAR |
| Active listings | 1.16 million | +5.4% year over year; 5.2% below September 2019 | September 2026 | Realtor.com |
| Rental vacancy rate | 7.3% | 7.0% a year earlier | Q2 2026 | Census HVS |
| Median new-lease rent | $1,388 | −0.4% year over year | September 2026 | Apartment List |
| CPI rent of primary residence | +2.8% a year | CPI shelter +3.2% | September 2026 | BLS |
Are home prices still going up?
Nationally, yes, but slowly. The median existing home sold for $417,500 in September 2026, 1.3% more than a year earlier ($412,300). NAR counts that as the 39th straight month of year-over-year gains.
Other measures agree on direction. FHFA's purchase-only index, which tracks repeat sales of the same homes using mortgage data from Fannie Mae and Freddie Mac, was up 2.6% in July 2026, its latest month. Zillow's typical home value index for mid-tier homes was up 1.2% in September.
The gaps between them come partly from method and partly from timing and coverage. NAR's median is the middle price of homes that closed that month, so it moves when the mix of homes selling changes. A repeat-sales index compares the same houses over time. FHFA's latest month is July, behind the others. All three are nominal figures, not adjusted for inflation.
Region matters more than the national number. NAR's September median rose 4.7% in the Northeast and 3.1% in the Midwest, was up 0.2% in the South, and slipped 0.3% in the West.
Is it a buyer's or seller's market?
It is shifting toward buyers, though supply is still below where it was before the pandemic. NAR counted 1.60 million homes for sale at the end of September, up 4.6% from a year earlier. That is 4.8 months of supply at the current sales pace, up from 4.5 months.
Realtor.com's listing data shows the same trend. Active listings reached 1,161,615 in September 2026, 5.4% more than a year earlier but still 5.2% below September 2019. About 20.8% of listings had a price cut, and the median listing spent 61 days on the market. The median list price, $419,250, was 1.4% lower than a year earlier.
Sales are slow. Existing homes sold at a seasonally adjusted annual rate of 3.99 million in September, 2.2% below a year earlier. NAR's chief economist, Lawrence Yun, said: “Higher inventory and lengthening days on market give buyers improved negotiating power.”
What are mortgage rates doing?
They rose sharply this fall. Freddie Mac's weekly average for a 30-year fixed loan climbed from 6.71% on September 3 to 7.40% on October 8 and 15, the highest reading since November 16, 2023. It eased to 7.32% on October 22, 2026. The 15-year average was 6.68%.
Earlier in the year rates were much lower: the 52-week low was 5.98% on February 26, 2026. Since 2010, only 1.1% of weekly readings have been at or above today's level. Over the full survey back to 1971, the average is 7.68%, a reminder that the 2010s were unusually low.
The payment effect is large. On a $417,500 home with 20% down, principal and interest is about $2,294 a month at today's rate, or $296 more than at February's low. The table shows the arithmetic; it leaves out taxes, insurance and any mortgage insurance. NAR's affordability index fell to 105.4 from 106.7 a year earlier.
| 30-year rate | When | Loan | Monthly principal and interest |
|---|---|---|---|
| 5.98% | 52-week low, February 26, 2026 | $334,000 | $1,998 |
| 6.19% | A year earlier, October 23, 2025 | $334,000 | $2,043 |
| 7.32% | Latest, October 22, 2026 | $334,000 | $2,294 |
Are rents going up or down?
It depends on the measure: new-lease rents are about flat, while broader measures are up 2.7% to 2.8%. Apartment List's national median rent on new leases was $1,388 in September 2026, 0.4% lower than a year earlier and 0.1% lower than August. Apartment List says annual rent growth has been improving since bottoming at −1.6% in April.
Zillow's rent index, which covers single-family homes and condos as well as apartments, was $1,932 in September, up 2.7% from a year earlier. The government's CPI measure of rent of primary residence rose 2.8% over the year to September, and CPI shelter rose 3.2%.
These numbers measure different things. Apartment List estimates rents on newly signed leases. CPI rent samples rents that renter households pay, and BLS says most of those are continuing leases whose rent changes infrequently, which is why it tends to move more slowly than new-lease measures. Zillow's index is built differently again. None of these is the rent for your unit; local comparables are.
Is rental vacancy rising?
It has edged up, though the latest change is small. The Census Bureau's national rental vacancy rate was 7.3% in the second quarter of 2026, the same as the first quarter and up from 7.0% a year earlier. The Bureau says that year-over-year difference is not statistically significant. The last quarter with a higher rate was the third quarter of 2017 (7.5%).
The South has the most slack, at 9.5%. The Midwest was 6.9%, the Northeast 5.9% and the West 5.3%. The homeownership rate was 65.0%, unchanged from a year earlier.
Apartment List's own vacancy index, which covers stabilized properties on its marketplace, points to a turn. It was 7.0% in September, down from a peak of 7.3% in February, but still above its 2017–2019 average of 6.4%. Units leased in September had been listed for an average of 34 days.
Census vacancy figures are survey estimates with margins of error, and the fourth-quarter 2025 figure covers only November and December because data was not collected in October 2025 during the federal funding lapse. Third-quarter 2026 figures are scheduled for October 28, 2026.
How much new housing is being built?
Fewer homes are being finished than a year ago, especially apartments, while new starts are mixed. From January through September 2026, about 301,600 units were completed in buildings with five or more units, 16.3% fewer than in the same months of 2025 (360,400). The full-year 2024 total was about 591,700.
Completions matter most for rental supply now because they are the units reaching the market. Starts show what comes later: apartment starts so far in 2026 are 6.9% above the same months of 2025, a change within the Census Bureau's margin of error, even though September's single-month figure was 25.9% below a year earlier. Apartment permits were roughly level (+1.0% year over year in September).
Single-month figures are preliminary and get revised, and the Census Bureau's confidence intervals on them are wide. September's 7.4% drop in total starts and 20.4% drop in apartment completions are both within those intervals, so the year-to-date totals are the steadier read.
| Stage | All housing | 5+ unit buildings | 5+ units vs a year earlier |
|---|---|---|---|
| Permits | 1.400 million | 503,000 | +1.0% |
| Starts | 1.221 million | 349,000 | −25.9% |
| Completions | 1.192 million | 339,000 | −20.4% |
Which markets are cooling, and which are heating up?
Zillow's file covers 49 of the 50 largest metros. Among them, home values fell over the past year in 16. The weakest were in Texas and the Mountain West; the strongest were in the Midwest and the Northeast, including New York.
On Zillow's measure, rents were flat or rising in 48 of those 49 metros. The fastest growth was in the Bay Area: San Francisco (+11.8%) and San Jose (+8.3%). Apartment List reports a similar pattern and links it to AI-driven tech hiring there, while it describes Sun Belt markets that added the most apartments as still seeing the largest declines, though smaller than earlier in the year.
| Metro | Home values (ZHVI) | Rents (ZORI) |
|---|---|---|
| Austin, TX | −4.3% | +0.7% |
| Las Vegas, NV | −2.6% | +0.5% |
| Dallas, TX | −2.0% | +0.7% |
| San Antonio, TX | −1.9% | −0.7% |
| Houston, TX | −1.8% | +0.1% |
| Milwaukee, WI | +5.3% | +5.1% |
| Hartford, CT | +5.1% | +3.5% |
| Chicago, IL | +5.0% | +4.7% |
| New York, NY | +4.9% | +4.2% |
| Cleveland, OH | +3.9% | +4.5% |
What this means for landlords
For an owner of a few units, the national picture matters less than the block. These are considerations to weigh against your own market, not recommendations.
- Renewals: new-lease rents are close to flat nationally, and units leased in September had been listed for about 34 days. Weigh a month or more of vacancy plus turnover costs against the renewal increase you are considering, and check your state and local notice rules before sending one.
- Vacancy risk is regional: rental vacancy in the South (9.5%) is far above the West (5.3%). Markets with the most new apartments have had the weakest rents, so price against current local listings, not last year's lease.
- Supply: apartment completions so far in 2026 are 16.3% below 2025, so fewer brand-new units are competing for tenants this year. Apartment starts are running near last year's pace (+6.9% year to date, within the Census margin of error), so new units are still in the pipeline. Apartment List expects rental conditions to keep tightening; that is its outlook, not ours.
- Refinancing: at 7.32% a refinance only lowers the rate for loans above that level, and the rate moved by about 1.4 points between late February and early October. A break-even calculation tells you whether closing costs pay back before you would sell or refinance again.
- Buying or selling: more listings, 4.8 months of supply and about one in five listings with a price cut favor buyers more than a year ago. Individual investors and second-home buyers made up 20% of September sales, according to NAR.
- Costs this page does not track yet: insurance premiums and property taxes vary by state and county. Check your renewal quote and your assessment notice against your rent roll directly.
What changed in this update
First published October 23, 2026. Future updates will list the figures that moved and any change in how we read them.
Methodology: how we track this
We pull each figure from the publisher's own data file, release or report page with a script, save the raw response, and compute every change and payment from those values. We do not estimate or fill in missing data.
Sources: Freddie Mac's weekly mortgage survey; NAR's monthly existing-home sales release; FHFA's monthly purchase-only house price index; Realtor.com's national inventory file; the Census Bureau's New Residential Construction and Housing Vacancy Survey tables; the BLS consumer price index; Zillow's rent and home value indexes; and Apartment List's national rent report.
We plan to refresh this page monthly, after the NAR, Census construction, BLS CPI and Apartment List releases. The mortgage rate is the latest weekly figure at the time of each refresh. Vacancy updates quarterly.
Limitations
Keep these limits in mind when reading the numbers above.
- National figures hide large local differences. Your county, neighborhood and unit type matter more.
- The measures use different definitions and timing. They are shown side by side, not merged.
- Monthly construction and sales figures are preliminary and get revised. Census survey estimates have margins of error.
- Price and rent figures are nominal, not adjusted for inflation.
- The October 2025 federal funding lapse left gaps: the Census vacancy survey skipped October 2025, and the BLS series used here has no October 2025 value.
- Zillow's methodology pages could not be opened from our research environment, so its indexes are described from the labels on its published data files. Its file covers 49 of the 50 largest metros.
- This page does not forecast the market. Any outlook on this page is attributed to its publisher.
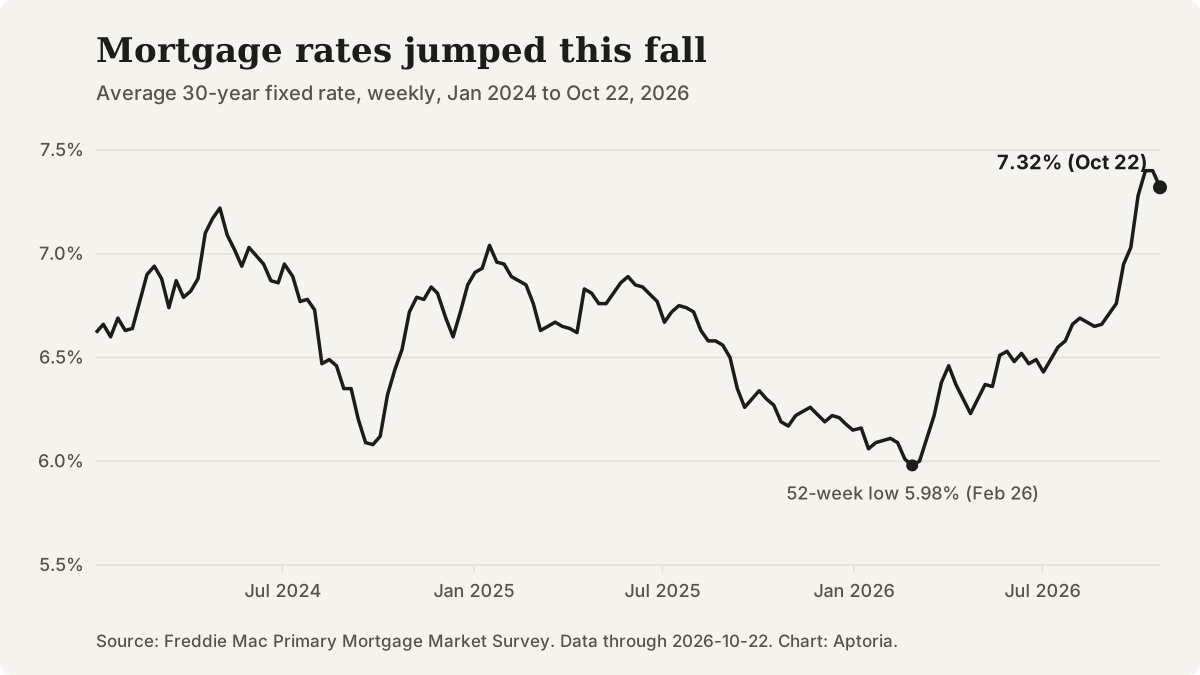
Freddie Mac's weekly average 30-year fixed rate, January 2024 to October 22, 2026. Source: Freddie Mac Primary Mortgage Market Survey.
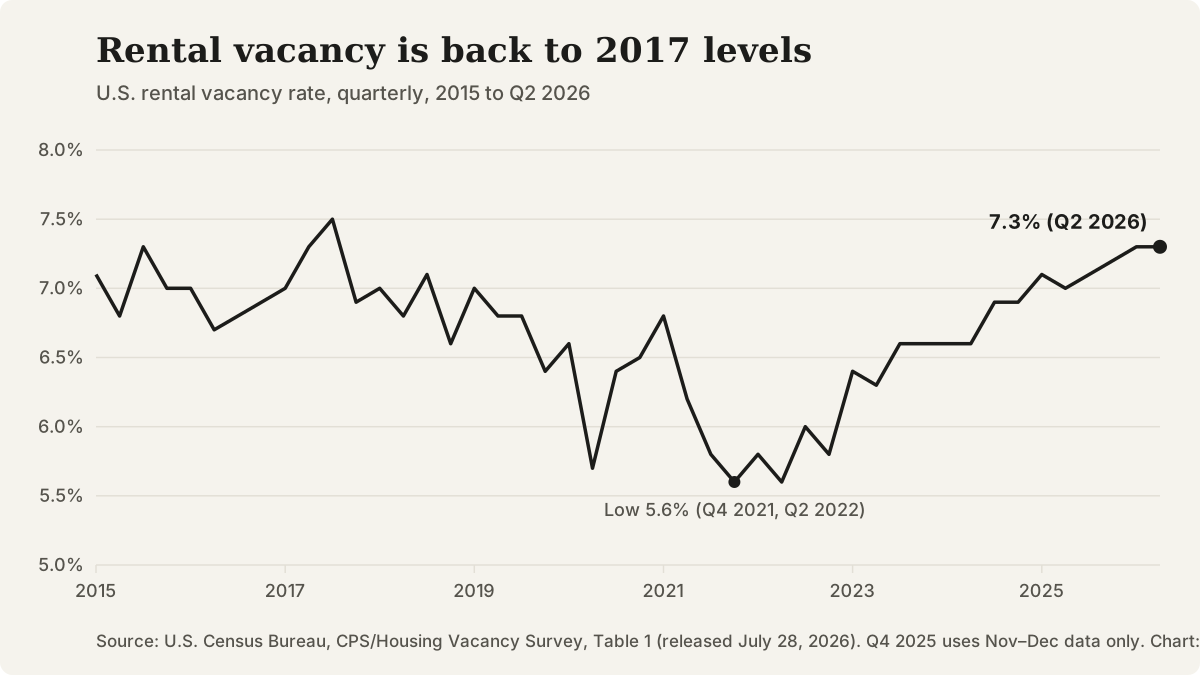
U.S. rental vacancy rate by quarter, 2015 to Q2 2026. Source: U.S. Census Bureau, CPS/Housing Vacancy Survey.
Questions that come up
How often is this page updated?
We plan a monthly refresh after the main national releases, and we update the mortgage rate to the latest weekly survey each time. The updated date at the top shows when the figures last changed, and the revision history lists what moved.
Is a 7% mortgage rate high by historical standards?
Compared with the 2010s, yes: since 2010 only 1.1% of weekly readings were at or above 7.32%. Over Freddie Mac's full history back to 1971 the average is 7.68%, so today's rate is a little below the long-run average.
What is the difference between the rental vacancy rate and the homeownership rate?
Both come from the same Census survey. The rental vacancy rate is the share of rental homes that are vacant and for rent (7.3% in Q2 2026). The homeownership rate is the share of occupied homes lived in by their owners (65.0%).
Where can I see numbers for my own market?
Zillow, Apartment List and Realtor.com publish metro and city data. For pricing a specific unit, compare current listings and recent leases nearby, which is what the market rent comparables workbook is built for.
Sources and references
Follow each source to check the underlying claim. Access checks and professional review are different steps.