The short answer
In the second quarter of 2026, Census estimates put rental vacancy highest among the 75 largest metros in Buffalo, NY (22.0%), Austin and San Antonio, TX (16.9% each), and lowest in San Jose, CA (0.5%). Metro estimates are imprecise, though: by our conservative test, at least 21 of the 75 differ significantly from the 7.3% national rate.
Key takeaways
Metro rental vacancy at a glance
The figures come from the Census Bureau's Housing Vacancy Survey for the second quarter of 2026, released July 28, 2026. The significance counts are our calculation, using the margins of error Census publishes with each metro estimate.
| Measure | Value | Source |
|---|---|---|
| U.S. rental vacancy rate | 7.3% (90% margin ±0.246 points) | Census release |
| Inside metropolitan areas | 7.5% | Census Table 1 |
| Highest of the 75 largest metros | Buffalo, NY, 22.0% (±9.7) | Census Table 4 |
| Lowest of the 75 largest metros | San Jose, CA, 0.5% (±0.9) | Census Table 4 |
| Metros significantly above the U.S. rate (conservative test) | At least 7 | Aptoria test of Census estimates |
| Metros significantly below the U.S. rate (conservative test) | At least 14 | Aptoria test of Census estimates |
| Metros not distinguishable from the U.S. rate under that test | 54 | Aptoria test of Census estimates |
| Median metro margin of error | ±3.6 points (range ±0.9 to ±9.7) | Census Table 4 |
Which metros have the highest rental vacancy?
Buffalo, NY had the highest estimate in the second quarter of 2026, at 22.0%, followed by Austin and San Antonio, TX at 16.9% each. The ranges are wide: Buffalo's margin of error is ±9.7 points.
By our test, at least seven metros were significantly above the national rate, and four of them are in Texas: Austin, San Antonio, Houston and Dallas. The others were Buffalo, NY, Birmingham, AL and New Orleans, LA.
Not every metro near the top of the list is clearly different from the country as a whole. Four of the 10 highest, including Greenville, SC and Tucson, AZ, were not statistically different from the national rate under our conservative test, and Greenville, SC and Tucson, AZ sit right at the cutoff.
| Metro area | Rate | 90% margin | 90% interval | Compared with U.S. |
|---|---|---|---|---|
| Buffalo-Cheektowaga, NY | 22.0% | ±9.7 | 12.3–31.7% | Above U.S. |
| Austin-Round Rock-San Marcos, TX | 16.9% | ±4.9 | 12.0–21.8% | Above U.S. |
| San Antonio-New Braunfels, TX | 16.9% | ±5.3 | 11.6–22.2% | Above U.S. |
| Greenville-Anderson-Greer, SC | 16.4% | ±9.1 | 7.3–25.5% | Not statistically different |
| Tucson, AZ | 15.3% | ±8.0 | 7.3–23.3% | Not statistically different |
| Birmingham, AL | 14.5% | ±5.6 | 8.9–20.1% | Above U.S. |
| New Orleans-Metairie, LA | 14.1% | ±5.6 | 8.5–19.7% | Above U.S. |
| McAllen-Edinburg-Mission, TX | 13.5% | ±9.4 | 4.1–22.9% | Not statistically different |
| Houston-Pasadena-The Woodlands, TX | 12.9% | ±3.0 | 9.9–15.9% | Above U.S. |
| Baton Rouge, LA | 12.2% | ±5.8 | 6.4–18.0% | Not statistically different |
Which metros have the lowest rental vacancy?
San Jose, CA had the lowest estimate, at 0.5%, followed by Knoxville, TN (1.7%) and Cincinnati, OH (2.3%).
At least fourteen metros were significantly below the national rate, including New York, Los Angeles and San Francisco. Low estimates also carry margins: a 1.7% estimate with a ±2.7-point margin has a 90% interval from 0% to 4.4%.
| Metro area | Rate | 90% margin | 90% interval | Compared with U.S. |
|---|---|---|---|---|
| San Jose-Sunnyvale-Santa Clara, CA | 0.5% | ±0.9 | 0.0–1.4% | Below U.S. |
| Knoxville, TN | 1.7% | ±2.7 | 0.0–4.4% | Below U.S. |
| Cincinnati, OH-KY-IN | 2.3% | ±2.4 | 0.0–4.7% | Below U.S. |
| Bridgeport-Stamford-Danbury, CT | 2.8% | ±3.3 | 0.0–6.1% | Below U.S. |
| San Diego-Chula Vista-Carlsbad, CA | 2.9% | ±2.0 | 0.9–4.9% | Below U.S. |
| Worcester, MA | 3.2% | ±3.9 | 0.0–7.1% | Below U.S. |
| Omaha, NE-IA | 3.4% | ±2.5 | 0.9–5.9% | Below U.S. |
| Salt Lake City-Murray, UT | 3.5% | ±2.6 | 0.9–6.1% | Below U.S. |
| Riverside-San Bernardino-Ontario, CA | 3.6% | ±2.2 | 1.4–5.8% | Below U.S. |
| Orlando-Kissimmee-Sanford, FL | 3.7% | ±2.5 | 1.2–6.2% | Below U.S. |
How precise are metro vacancy rates?
Not very, for a single quarter. The median metro margin of error is about ±3.6 percentage points, against ±0.246 for the national rate. Census describes its margins as 90% confidence ranges, and its source-and-accuracy statement asks users to take particular care with figures built from a small number of cases, and with small differences between estimates.
Under our test, 54 of the 75 metros could not be told apart from the national rate this quarter, and two of those were right at the cutoff: Greenville, SC and Tucson, AZ missed it by less than a hundredth of a standard error. Changes from one quarter to the next are hard to pin down too. At least five metros changed significantly from the first to the second quarter of 2026: rates rose in Austin and Hartford and fell in Jacksonville, Oklahoma City and Omaha.
With margins this wide, a metro's place in a single quarter's ranking is a rough guide. Treat the list as a screen for where to look more closely, not as a measure of any single neighborhood.
Can you compare 2026 metro rates with earlier years?
Not directly. Starting in 2026, the survey uses post-2020 metro boundaries published by the Office of Management and Budget in July 2023, and Census says the 2026 metro data may not be directly comparable with earlier years. This page does not compute changes across that break.
On the older boundaries, Census's annual 2025 table covers the whole year except October 2025, when the survey did not collect data during the federal funding lapse; Census cautions that the annual 2025 estimates carry more uncertainty as a result. On that basis the rate inside metro areas was 7.2% in 2025, compared with 6.8% in 2024, and the highest metros were Charleston, SC (18.7%), Syracuse, NY (17.2%) and North Port, FL (16.6%). That table publishes no margins of error, so we do not test the 2025-versus-2024 differences.
The list of metros itself changed with the new boundaries: Charleston, Syracuse, North Port and Little Rock, all among the highest in 2025, have no 2026 estimate in Census's quarterly table.
| Metro area (2010-based definition) | 2025 | 2024 |
|---|---|---|
| Charleston-North Charleston-Summerville, SC | 18.7% | 12.8% |
| Syracuse, NY | 17.2% | 4.0% |
| North Port-Bradenton-Sarasota, FL | 16.6% | 10.1% |
| Birmingham-Hoover, AL | 14.6% | 15.1% |
| Baton Rouge, LA | 13.9% | 7.3% |
| Austin-Round Rock, TX | 13.7% | 8.2% |
| Buffalo-Cheektowaga-Niagara Falls, NY | 13.0% | 10.8% |
| Little Rock-North Little Rock-Conway, AR | 12.3% | 11.7% |
| Tucson, AZ | 11.9% | 9.3% |
| Houston-The Woodlands-Sugar Land, TX | 11.5% | 9.8% |
How does vacancy differ by region?
In the second quarter of 2026, the South had the highest regional rental vacancy rate, at 9.5%, and the Midwest was next at 6.9%. The Northeast (5.9%) and the West (5.3%) were lower, and Census's release treats those two as statistically indistinguishable. Our housing market page covers the national trend and new apartment supply.
What this means for landlords
These are considerations to weigh against your own listings and leases, not recommendations.
- A high metro estimate is a reason to check your own submarket closely: current comparable listings, how long similar units are taking to lease, and whether competitors are offering concessions.
- In metros significantly above the national rate, budget assumptions for a longer vacancy or a concession at turnover may be more realistic than last year's numbers. A vacancy cost calculator shows what each extra week costs.
- In metros significantly below the national rate, a smaller share of rentals is sitting vacant, but pricing still depends on the specific unit and street. Comparable rents are the better guide than a metro average.
- Because single-quarter estimates swing, look at more than one quarter before changing a pricing approach, and track your own days vacant and inquiries.
- A metro rate covers all rental housing in a large area. Your property type, size and location within the metro can behave very differently.
Methodology
We download Census's quarterly metro table, its national release, its regional history table and its annual 2025 tables with a script, and compute every ranking and count from those files.
To compare a metro with the nation, we follow the test in Census's source-and-accuracy statement: a difference is significant at the 0.10 level when it exceeds 1.645 times its standard error. We convert each published 90% margin of error to a standard error by dividing by 1.645 and estimate the standard error of the difference as the square root of the sum of the two squared standard errors. That treats the two estimates as independent, which Census's statement does not prescribe. A metro is part of the national sample and consecutive quarters share respondents, so the estimates are likely positively related; ignoring that tends to overstate the standard error of the difference, which makes our counts of significant differences conservative. The same method is used for first-to-second-quarter changes.
The 90% interval shown for each metro is the estimate plus or minus its margin of error, with negative lower bounds shown as 0%.
Census publishes third-quarter 2026 figures on October 28, 2026; we plan to refresh this page after that release.
Limitations
Read the rankings with these limits in mind.
- Metro estimates come from a national survey and carry wide margins of error; many differences between metros are not statistically significant.
- The significance counts use an approximation that ignores any correlation between estimates.
- 2026 metro boundaries differ from earlier years, so 2026 figures should not be compared directly with the annual 2025 table. Census's Table 4 cites OMB Bulletin 23-01 of July 21, 2023 for the new boundaries; its source-and-accuracy statement dates the definitions to February 2023.
- The annual 2025 figures exclude October 2025, and that table does not publish margins of error.
- Census will publish third-quarter 2026 figures on October 28, 2026; this page reflects the second quarter.
- Only the 75 largest metro areas are covered.
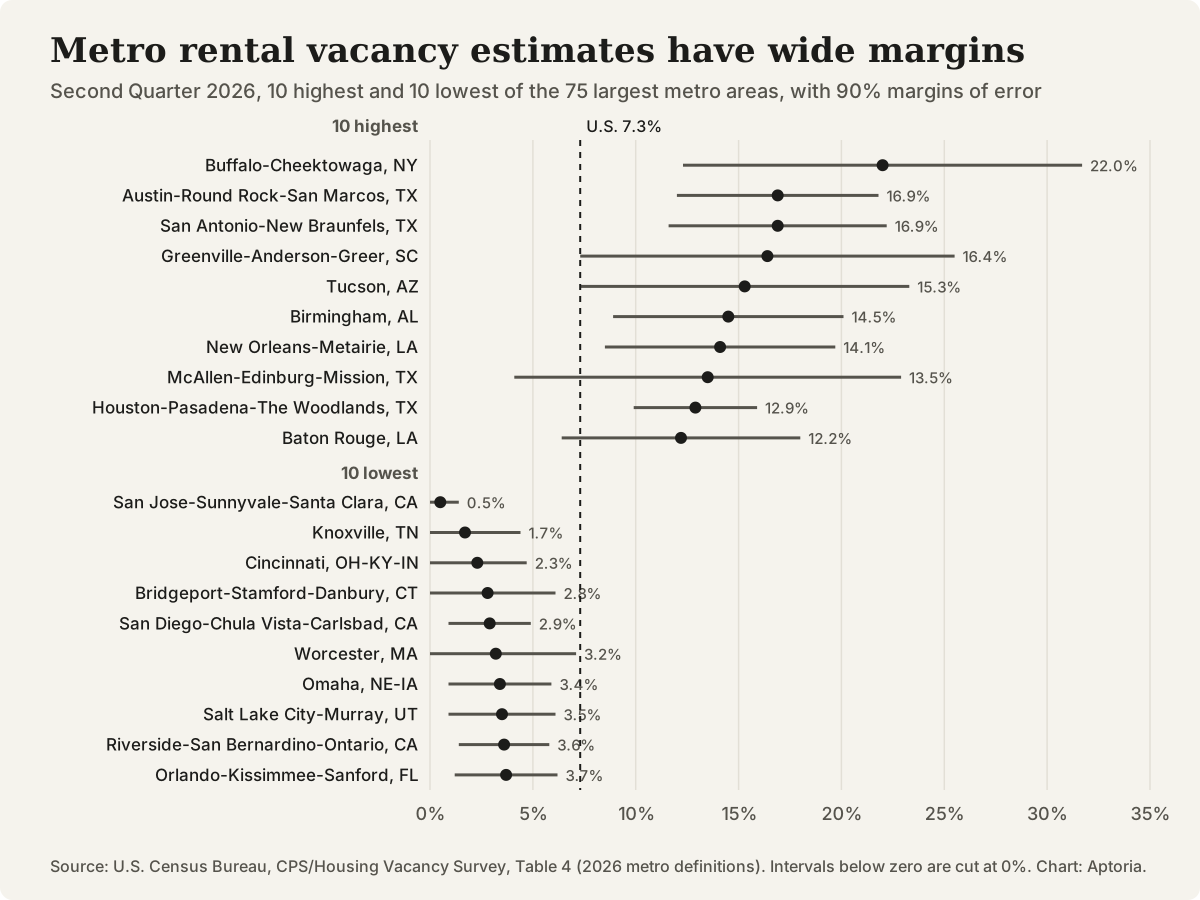
Rental vacancy rates with 90% margins of error, 10 highest and 10 lowest of the 75 largest metros, second quarter 2026. Source: U.S. Census Bureau, CPS/Housing Vacancy Survey.
Questions that come up
What does the rental vacancy rate measure?
Census describes it as the share of the rental housing stock that is vacant and for rent. It covers rental units only, not all housing.
Why isn't my metro area listed?
Census publishes quarterly metro vacancy rates only for the 75 largest metropolitan areas. For smaller areas, local listing data and your own leasing history are the practical guides.
How often are metro vacancy rates updated?
Census releases them quarterly with its Housing Vacancy Survey. The next release, covering the third quarter of 2026, is scheduled for October 28, 2026.
Does this page predict which metros will tighten or loosen?
No. This page reports Census estimates and their margins of error and explains how to read them. It does not forecast vacancy.
Sources and references
Follow each source to check the underlying claim. Access checks and professional review are different steps.