The short answer
Interest rates change what buyers can borrow, whether owners want to sell, and what a rental property's numbers look like. Mortgage rates have tracked longer-term Treasury yields more closely than the Fed's rate: after the Fed cut 1 point in late 2024, the 30-year rate rose from 6.09% to 7.04% by January 2025. As of October 22, 2026 it was 7.32%.
Key takeaways
Where rates stand now
These are the latest figures available on October 23, 2026. The spread is our calculation: the weekly mortgage rate minus the average 10-year Treasury yield over the same survey week.
| Measure | Latest | As of | Source |
|---|---|---|---|
| Federal funds target range | 3.75% to 4.00% | Raised 0.25 point, effective September 17, 2026 | Federal Reserve |
| 10-year Treasury yield | 5.00% | October 23, 2026 | U.S. Treasury |
| 30-year fixed mortgage rate | 7.32% | Week of October 22, 2026 | Freddie Mac |
| Mortgage rate minus 10-year yield | 2.20 points | Week of October 22, 2026 | Aptoria calculation |
| Outstanding mortgages below 4% | 49.1% | 2026 Q2 | FHFA |
| Average rate on outstanding mortgages | 4.4% | 2026 Q2 | FHFA |
Does a Fed rate cut lower mortgage rates?
Not directly. The Federal Reserve sets a target for the federal funds rate, which is the rate banks charge each other to lend reserves overnight. A 30-year mortgage is a long loan, and its rate has moved more closely with the 10-year Treasury yield than with that overnight rate.
Late 2024 shows the gap. The Fed cut its target range by 0.50 point effective September 19, 2024 and by 1.00 point in total by December. The 30-year mortgage rate was 6.09% when the first cut took effect, 6.72% when the last one did, and 7.04% by January 16, 2025. Over that stretch the 10-year yield climbed from about 3.66% to 4.74%. Mortgage rates had already fallen from 7.22% in May 2024 before the first cut.
This fall the Fed moved the other way. At its September 15–16, 2026 meeting it raised the target range by a quarter point, to 3.75% to 4.00%, saying inflation remains elevated. The mortgage rate rose from 6.76% to 7.32% over the following weeks, again alongside a higher 10-year yield. The link between the Fed's rate and mortgage rates is not one-for-one.
| Fed move | 30-year rate before | 30-year rate after | 10-year yield, same weeks |
|---|---|---|---|
| Cut 1.00 point (Sep–Dec 2024) | 6.09% (September 19, 2024) | 7.04% (January 16, 2025) | 3.66% → 4.74% |
| Raised 0.25 point (Sep 2026) | 6.76% (September 10, 2026) | 7.32% (October 22, 2026) | 4.79% → 5.12% |
Why are mortgage rates higher than Treasury yields?
Borrowers pay a spread above the 10-year yield. In the survey released October 22, 2026, the 30-year rate of 7.32% was 2.20 points above the 10-year's 5.12% average for that week.
The spread changes over time. By our calculation it averaged 2.52 points in 2024, 2.30 points in 2025 and 1.98 points so far in 2026. A narrower spread can partly offset a rise in Treasury yields, and a wider one can push mortgage rates up even when yields are steady.
What is the mortgage rate lock-in effect?
Selling a home usually means paying off its mortgage, so an owner with a 3% loan who would borrow at about 7% to buy again faces a much higher payment. FHFA data shows how common those low rates are: in the second quarter of 2026, 49.1% of outstanding mortgages had a rate below 4%, and the average outstanding rate was 4.4%, against 7.32% for a new 30-year loan today.
That share has been shrinking. It peaked at 65.2% in the first quarter of 2022. The share of mortgages at 6% or more rose from 7.5% to 22.5% over the same period.
A working paper by FHFA researchers (revised August 2024) put numbers on the effect. In its estimates, a sale became 18.1% less likely for every point that market rates sat above the owner's existing rate, and lock-in prevented about 1.72 million home sales from the second quarter of 2022 through the second quarter of 2024. Those estimates cover that period, not today.
| Rate on the mortgage | 2022 Q1 | 2026 Q2 |
|---|---|---|
| Below 3% | 24.6% | 19.2% |
| 3% to under 4% | 40.6% | 29.9% |
| 4% to under 5% | 20.3% | 16.5% |
| 5% to under 6% | 7.0% | 12.0% |
| 6% or higher | 7.5% | 22.5% |
Do higher rates lower home prices?
They reduce what buyers can borrow, but national prices have kept rising. A $2,000 monthly payment for principal and interest supports a loan of about $474,000 at 3% but only about $291,000 at 7.32%.
Even so, FHFA's purchase-only house price index was 20.3% higher in July 2026 than in January 2022, when the 30-year rate averaged about 3.45%. After rates rose in 2022, the index dipped only 0.9% from its mid-2022 high before climbing again. These are nominal figures.
Research by FHFA economists points to supply as one reason. The same paper estimated that, over 2022 to mid-2024, the supply reduction from lock-in raised prices by 7.0%, while higher rates on their own lowered them by 5.6%. Local markets can behave very differently from the national index.
| Mortgage rate | Loan amount it supports |
|---|---|
| 3.00% | $474,000 |
| 5.00% | $373,000 |
| 7.32% (latest) | $291,000 |
How do interest rates affect rents?
Higher mortgage rates make buying more expensive, which can keep some households renting longer. In its national rent report published September 29, 2026, Apartment List said higher mortgage rates may lead some would-be first-time buyers to keep renting, which adds to rental demand.
Rents also depend on how many new rental units come to market. Our housing market page covers rents, vacancy and apartment completions.
How do rates change the numbers on a rental property?
Rates change your debt service, which changes cash flow and the debt service coverage ratio (DSCR) a lender looks at. In the illustrative example below, the same $26,000 of net operating income covers the loan payment 1.20 times at 6% but only 1.05 times at 7.32%, and pre-tax cash flow falls from $4,416 to $1,270 a year.
Rates can also affect what a property is worth if buyers demand a higher cap rate when borrowing costs more. At $26,000 of income, a 6.0% cap rate implies a value of about $433,000, 6.5% about $400,000 and 7.0% about $371,000.
These are round, hypothetical numbers. The 7.32% row uses Freddie Mac's survey average, which covers owner-occupied loans; the 6% and 7% rows are round examples. Your own loan quote and your lender's DSCR requirement are what count.
| Loan rate | Annual debt service | DSCR | Cash flow before tax |
|---|---|---|---|
| 6.00% | $21,584 | 1.20 | $4,416 |
| 7.00% | $23,951 | 1.09 | $2,049 |
| 7.32% | $24,730 | 1.05 | $1,270 |
Should landlords refinance when rates drop?
Only if the savings repay the costs before you would sell or refinance again. At 7.32%, a refinance lowers the rate only for loans above that level. FHFA data shows only 22.5% of outstanding mortgages carry a rate of 6% or more, and fewer still are above 7.32%.
A break-even calculation compares monthly savings with closing costs and any change in the loan term. Our refinance break-even guide and calculator walk through it with your own numbers. This is general information, not a recommendation to refinance.
What to watch next
Any outlook for where rates go next belongs to the forecaster who makes it. This page does not forecast rates.
- Fed meetings: the remaining 2026 FOMC meetings are October 27–28 and December 8–9.
- The 10-year Treasury yield, which the Treasury publishes every business day.
- Freddie Mac's mortgage survey, released each Thursday at noon Eastern.
- Inflation reports, since the Fed cited elevated inflation when it raised rates in September.
What this means for landlords
These are considerations to weigh against your own loans and market, not recommendations.
- Underwrite purchases at today's rate, not the rate you hope for. A Fed cut does not guarantee a lower mortgage rate.
- If your rate is well below the market, your existing loan is worth something. Weigh that before selling or doing a cash-out refinance.
- Check DSCR and cash flow at a rate one point higher than your quote. The illustrative example shows how quickly coverage thins.
- Fewer listings from lock-in can mean less competition for your property when you sell, and fewer choices when you buy.
- Higher ownership costs can keep some tenants renting longer, but new supply in your market also shapes rent.
Methodology
We pull the Fed's target-range history and statements, Treasury's daily yields, Freddie Mac's weekly survey and FHFA's mortgage and price data with a script, and compute every figure from those files.
The spread is the weekly 30-year rate minus the average 10-year par yield over the Thursday-to-Wednesday window that Freddie Mac's survey covers. Lock-in shares combine FHFA's below-3% and 3%-to-4% buckets for all outstanding mortgages in the National Mortgage Database. Payment, loan and DSCR figures use standard 30-year amortization.
Limitations
Read the numbers with these limits in mind.
- Two episodes show a pattern; they do not prove what caused each move in mortgage rates.
- FHFA's lock-in estimates come from a working paper revised in August 2024 and cover 2022 to mid-2024.
- The rental and buying-power examples are hypothetical and leave out taxes, insurance and fees.
- National figures hide local differences in prices, rents and loan terms.
- This page does not forecast interest rates or home prices.
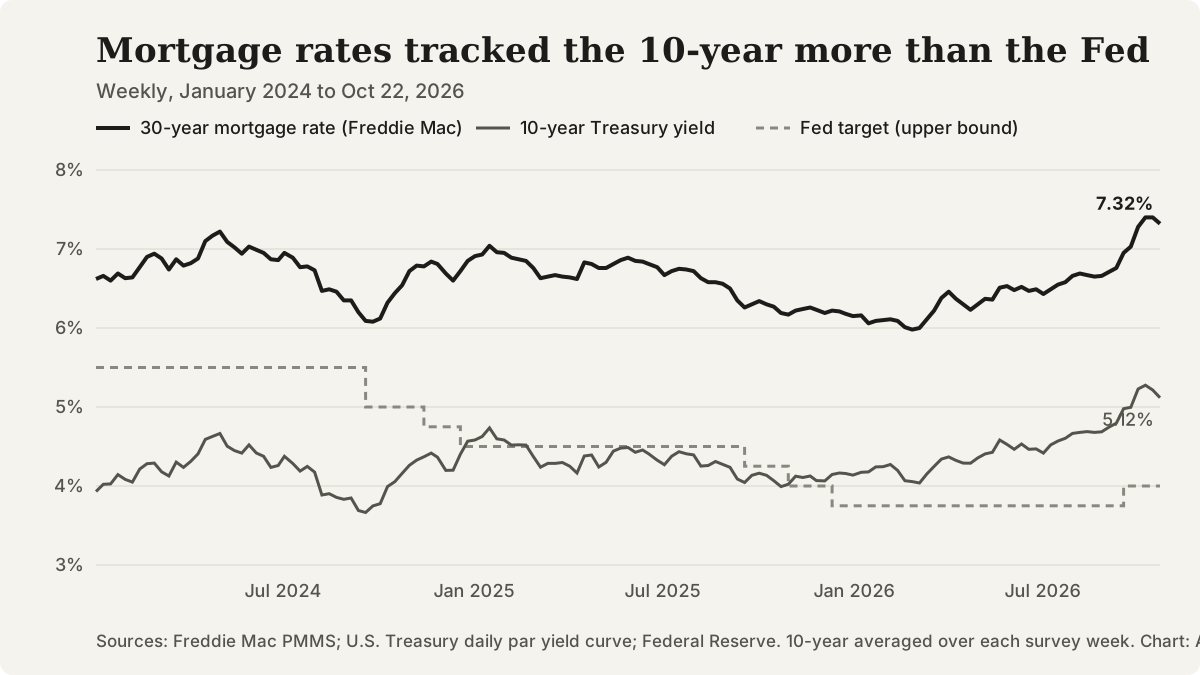
Weekly 30-year mortgage rate, 10-year Treasury yield and the Fed's target upper bound, January 2024 to October 22, 2026. Sources: Freddie Mac, U.S. Treasury, Federal Reserve.
Questions that come up
What is the federal funds rate?
It is the rate banks charge one another for overnight loans of reserves. The Fed sets a target range for it, currently 3.75% to 4.00%.
What mortgage rate do most homeowners have?
FHFA data shows an average rate of 4.4% on outstanding mortgages in the second quarter of 2026, with 49.1% of loans below 4%.
When does the Fed meet next?
The remaining 2026 meetings are October 27–28 and December 8–9. The Fed publishes a statement at the end of each meeting.
Does this page predict where rates are going?
No. This page reports published data and explains how rates work. Any forecast is attributed to whoever made it.
Sources and references
Follow each source to check the underlying claim. Access checks and professional review are different steps.