The short answer
On the loan payment alone it is roughly even. In September 2026, principal and interest on Zillow's typical U.S. home with 20% down was about $1,922 a month, against typical rent of $1,932, so any other owner cost above about $10 a month makes owning that home cost more. In 39 of 49 large metros, the payment alone exceeded rent.
Key takeaways
The numbers right now
This page compares the monthly cost of a new mortgage on a typical home with typical rent, using one method at every date: a 30-year fixed loan for 80% of Zillow's typical home value at that month's average Freddie Mac rate, against Zillow's typical rent for the same month.
In September 2026 the two were within $10 of each other. At the latest weekly rate of 7.32% (October 22, 2026), the same payment would be about $2,012, or $80 more than rent. Our housing market page has the wider market picture.
| Measure | Value | Source |
|---|---|---|
| Typical home value (Zillow ZHVI) | $366,157 | Zillow |
| Average 30-year rate, September 2026 | 6.86% | Freddie Mac |
| Principal and interest, 20% down | $1,922 a month | Aptoria calculation |
| Typical rent (Zillow ZORI) | $1,932 a month | Zillow |
| Payment as a share of rent | 0.99× | Aptoria calculation |
| Same payment at the October 22, 2026 rate (7.32%) | $2,012 a month (1.04× rent) | Aptoria calculation |
How has the rent-vs-buy gap changed since 2019?
The loan payment was far below rent before 2022. In September 2019 and September 2021, the payment on a typical home was about 64% and 65% of typical rent, with average rates of 3.61% and 2.90%.
That changed as rates and home values rose. The payment first exceeded rent in October 2022, fell back below it from December 2022 to May 2023, and was above rent in 22 of the 25 months from June 2023 to June 2025. The widest gap was about $206 a month, in October 2023.
From July 2025 through September 2026 the payment was below rent, by between $1 and $131 a month. At the October 22, 2026 weekly rate it would be $80 above rent. Between September 2023 and September 2025, the average rate fell from 7.20% to 6.35% while typical rent rose from $1,787 to $1,878.
| September | Typical home value | 30-year rate | Principal and interest | Typical rent | Payment minus rent |
|---|---|---|---|---|---|
| 2019 | $243,849 | 3.61% | $887 | $1,381 | −$494 |
| 2021 | $305,989 | 2.90% | $1,019 | $1,579 | −$560 |
| 2023 | $351,976 | 7.20% | $1,911 | $1,787 | +$124 |
| 2025 | $361,859 | 6.35% | $1,802 | $1,878 | −$76 |
| 2026 | $366,157 | 6.86% | $1,922 | $1,932 | −$10 |
What does the comparison leave out?
A lot. The payment above is principal and interest only. An owner also pays property taxes and homeowners insurance, and often maintenance, HOA dues and, with less than 20% down, mortgage insurance. Buying also has one-time costs such as closing costs, and selling later has its own.
To show the scale, add a round, hypothetical $500 a month for taxes and insurance. The owner's monthly cost becomes $2,422, about $490 more than typical rent. Your real taxes and premiums depend on where you buy.
On the other side, part of each mortgage payment pays down the loan and builds equity, and a home can gain or lose value. A full comparison needs your own numbers, which a rent-vs-buy calculator can help organize.
Does the answer depend on which price and rent you use?
Yes. NAR's median existing-home sale price for September was $417,500, higher than Zillow's typical home value, so the same method gives a payment of about $2,191. NAR's median is the middle price of homes that sold that month, while Zillow's index estimates a typical value across homes.
Rent measures differ too. Apartment List's national median, $1,388 as of September 2026, estimates rent on new leases, while Zillow's figure is a typical rent across the rental homes its index covers. They measure different things. Against Apartment List's figure, the typical payment is $534 higher.
| Home price used | Principal and interest | Rent used | Rent |
|---|---|---|---|
| Zillow typical home value | $1,922 | Zillow typical rent | $1,932 |
| NAR median existing-home sale price | $2,191 | Zillow typical rent | $1,932 |
| Zillow typical home value | $1,922 | Apartment List median new-lease rent | $1,388 |
Which metros favor renting or buying?
In most large metros the payment alone is above rent. Among the 49 metros Zillow ranks 1 to 50 (its ranking skips 33), principal and interest exceeded typical rent in 39.
The payment was furthest above rent in San Jose, CA (2.10 times rent), Salt Lake City, UT (1.78) and San Francisco, CA (1.71). At the other end, in Pittsburgh, PA it was 0.82 times rent. Among the 15 largest metros, the payment ran 1.70 times rent in Los Angeles and 0.86 times in Chicago.
| Metro | Typical home value | Principal and interest | Typical rent | Payment ÷ rent |
|---|---|---|---|---|
| New York, NY | $730,949 | $3,837 | $3,546 | 1.08 |
| Los Angeles, CA | $950,020 | $4,986 | $2,929 | 1.70 |
| Chicago, IL | $355,650 | $1,867 | $2,163 | 0.86 |
| Dallas, TX | $358,242 | $1,880 | $1,659 | 1.13 |
| Houston, TX | $302,832 | $1,589 | $1,638 | 0.97 |
| Washington, DC | $569,857 | $2,991 | $2,407 | 1.24 |
| Philadelphia, PA | $386,048 | $2,026 | $1,903 | 1.06 |
| Miami, FL | $476,815 | $2,503 | $2,654 | 0.94 |
| Atlanta, GA | $375,898 | $1,973 | $1,843 | 1.07 |
| Boston, MA | $725,639 | $3,809 | $2,987 | 1.28 |
| Phoenix, AZ | $441,097 | $2,315 | $1,720 | 1.35 |
| San Francisco, CA | $1,120,379 | $5,881 | $3,445 | 1.71 |
| Riverside, CA | $580,321 | $3,046 | $2,533 | 1.20 |
| Detroit, MI | $264,316 | $1,387 | $1,514 | 0.92 |
| Seattle, WA | $720,147 | $3,780 | $2,250 | 1.68 |
What this means for landlords
These are considerations for your own market, not recommendations.
- Local gaps are large in both directions. In San Jose, CA the typical payment alone was 2.10 times rent; in Pittsburgh, PA it was 0.82 times, about 18% below rent. Your own metro's figure is the more useful context for a renewal.
- The comparison moves with mortgage rates. At 7.32% instead of 6.86%, the national payment rises by about $90 a month.
- National and metro figures are context for a renewal, not a price. Your own unit's rent should come from current comparable listings and leases.
- Monthly cost is only one part of a decision to buy. These figures do not predict any one tenant's plans.
Methodology
Buying cost is monthly principal and interest on a 30-year fixed loan for 80% of Zillow's typical home value (mid-tier, smoothed, seasonally adjusted), at the average of Freddie Mac's weekly 30-year rates in that calendar month. Renting cost is Zillow's typical rent (all homes plus multifamily, smoothed, seasonally adjusted) for the same month, so both Zillow series are seasonally adjusted. The same method is used for every date and metro.
NAR's median sale price and Apartment List's median rent are shown only as cross-checks for the latest month. All figures are computed by script from the publishers' files.
Limitations
Keep these limits in mind.
- Principal and interest is not the full cost of owning, and the hypothetical add-on is a round illustration, not an estimate.
- Freddie Mac's survey average is for owner-occupied loans with strong credit; your rate can differ.
- Zillow's indexes are modeled typical values, not the price of any specific home or rental.
- Zillow's methodology pages could not be opened from our research environment, so its indexes are described from the labels on its published data files.
- The metro view covers the 49 metros Zillow ranks 1 to 50 (its ranking skips 33).
- Zillow's latest seasonally adjusted rent month equals its unadjusted value in the files used here, and recent months can be revised.
- This page does not give financial advice or predict prices, rents or rates.
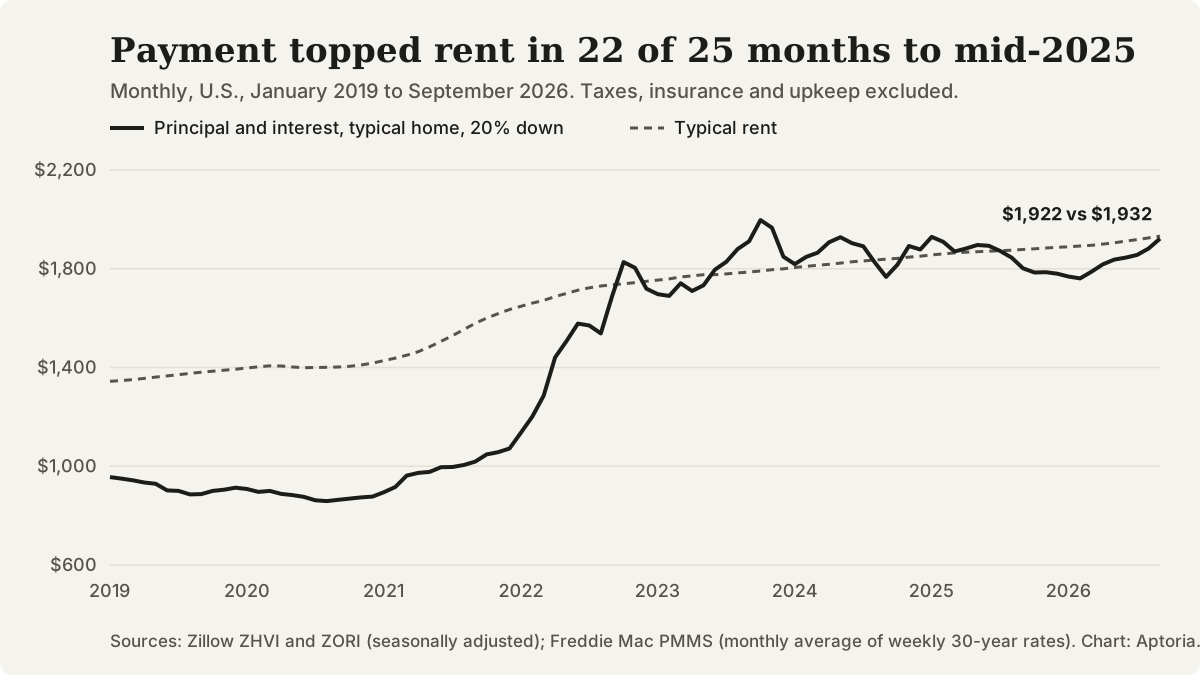
Monthly principal and interest on Zillow's typical U.S. home with 20% down vs Zillow's typical rent, January 2019 to September 2026. Sources: Zillow, Freddie Mac.
Questions that come up
Why compare only principal and interest?
It can be calculated the same way for every month and metro from published home values and mortgage rates. Taxes, insurance and upkeep vary widely by place, so the page shows them only as a round hypothetical.
What down payment and mortgage rate does this use?
A 20% down payment and the average of Freddie Mac's weekly 30-year fixed rates for the month, 6.86% in September 2026. A smaller down payment means a larger loan and, often, mortgage insurance.
Is buying a better long-term choice than renting?
This page compares monthly cash costs only. The long-term answer depends on how long you stay, price changes, equity, transaction costs and your finances, and it is not something national data can settle.
How often is this page updated?
We plan to refresh it monthly after Zillow's data release, using the latest Freddie Mac rates. The updated date and revision history show what changed.
Sources and references
Follow each source to check the underlying claim. Access checks and professional review are different steps.