The short answer
No, not over the past year. The U.S. homeownership rate was 65.0% in the second quarter of 2026, virtually the same as a year earlier, according to the Census Bureau. The survey counts about 46.83 million renter households, 35.0% of all households. Among age groups, the one significant shift is among householders under 35, whose ownership rate fell to 35.2% from 36.4%.
Key takeaways
The key numbers
All figures come from the Census Bureau's Current Population Survey/Housing Vacancy Survey, released July 28, 2026. Year-over-year household changes and their significance are the Census Bureau's own, using its revised Q2 2025 estimates.
| Measure | Q2 2026 | Q2 2025 | Change, per Census |
|---|---|---|---|
| Homeownership rate | 65.0% | 65.0% | Virtually the same |
| Homeownership rate, seasonally adjusted | 65.2% | 65.2% | Not statistically different |
| Renter households | 46.83 million | 46.38 million | +450,000 ± 784,000; not statistically significant |
| Owner households | 86.99 million | 86.21 million | +780,000 ± 631,000 (+0.9%); statistically significant |
| Homeownership rate, householders under 35 | 35.2% | 36.4% | Lower; statistically significant |
Is homeownership falling?
Not over the past year. The rate was 65.0% in the second quarter of 2026, the same as in Q2 2025, and the Census Bureau describes the two as virtually the same. The seasonally adjusted rate was 65.2% in both quarters.
Over longer stretches it has moved more. Since 1994 the rate reached its high of 69.2% in both the second and fourth quarters of 2004 and its low of 62.9% in the second quarter of 2016. Just before the pandemic it was 65.1% in the fourth quarter of 2019 and 65.3% in the first quarter of 2020, close to today's level.
Are there more renter households than a year ago?
The survey can't say for sure. It estimates 46.83 million renter households in the second quarter of 2026, against a revised 46.38 million a year earlier. The Census Bureau puts the difference at 450,000 with a 90% margin of error of ±784,000, so the change is not statistically significant.
Owner households did grow measurably: up 780,000 (±631,000), or 0.9%. Renters make up 35.0% of occupied households.
Over a longer span, the survey's renter count is about 2.89 million higher than in the second quarter of 2019 (43.94 million). Those figures come from different rounds of Census housing unit controls, so treat that as a rough comparison, not a measured change.
How does homeownership differ by age?
In the second quarter of 2026, each older age bracket had a higher ownership rate than the one before it, from 35.2% for householders under 35 to 78.6% for those 65 and older.
The under-35 group is the only one whose rate changed significantly from a year earlier, according to the Census Bureau: it fell from 36.4% to 35.2%. Since 1994 that group's rate has ranged from 34.1% (the second quarter of 2016) to 43.6% (the second quarter of 2004).
This is aggregate data about households. It describes the overall market, not any applicant, and it is not a basis for choosing or advertising to tenants. Apply consistent written criteria to every applicant, follow applicable law, and make reasonable accommodations where the law requires them.
| Age of householder | Q2 2019 | Q2 2025 | Q2 2026 |
|---|---|---|---|
| Under 35 | 36.4% | 36.4% | 35.2% |
| 35 to 44 | 59.4% | 61.0% | 60.9% |
| 45 to 54 | 70.1% | 69.2% | 69.7% |
| 55 to 64 | 74.8% | 75.8% | 75.1% |
| 65 and over | 78.0% | 78.6% | 78.6% |
| U.S. | 64.1% | 65.0% | 65.0% |
How does homeownership vary by region?
The Midwest has the highest rate (69.0%) and the West the lowest (60.5%). The Census Bureau found that none of the four regional rates changed significantly from a year earlier.
Regional 90% margins of error run from ±0.5 to ±0.7 points, against ±0.5 nationally, so small regional moves deserve caution. The regional renter-household counts come from the historical tables, which publish no margins of error, so we show levels only.
| Region | Rate, Q2 2026 | Margin of error | Rate, Q2 2025 | Renter households (estimate) |
|---|---|---|---|---|
| Midwest | 69.0% | ±0.6 pts | 69.5% | 8.88 million |
| South | 66.9% | ±0.5 pts | 66.6% | 17.29 million |
| Northeast | 61.6% | ±0.7 pts | 61.4% | 8.81 million |
| West | 60.5% | ±0.6 pts | 60.7% | 11.85 million |
What does this mean for rental demand?
The national change in renter households is too small to measure with confidence. Census's 90% interval for it runs from about −0.7% to +2.7%. Renter households also count occupied rentals, not everyone looking to rent, so they are an imperfect measure of demand.
Demand is only half the picture. Whether a market feels tight depends on how many units are vacant and how many new ones are being finished. Our housing market page tracks rental vacancy and apartment completions, and our interest-rates explainer covers how mortgage rates affect the cost of buying.
What this means for landlords
These are considerations to weigh against your own market, not forecasts or recommendations.
- The national survey cannot tell whether renter households grew this year. Your own vacancy, inquiries and days on market are better signals for your units.
- Don't read much into small regional moves. Regional margins of error run from ±0.5 to ±0.7 points, and none of this year's regional rate changes were statistically significant.
- Price renewals and vacancies against current local listings and leases, not national household counts.
- Market statistics describe groups, not people. Apply consistent written criteria to every applicant, follow applicable fair-housing law, and make reasonable accommodations where required.
Methodology
We download the Census Bureau's Housing Vacancy Survey historical tables and its quarterly press release with a script. Rates are read directly from the Census tables. Shares and long-run comparisons are computed from them.
Year-over-year household changes, their margins of error and all statements about statistical significance come from the Census release, which uses revised Q2 2025 estimates. We don't run significance tests ourselves.
Limitations
Keep these limits in mind.
- All figures are survey estimates with margins of error. Small changes may not be meaningful.
- The fourth-quarter 2025 estimates cover only November and December, because the survey did not collect data in October 2025 during the federal funding lapse.
- Historical household counts are revised with new housing unit controls, so comparisons across many years are approximate.
- Census is phasing in a new survey sample from April 2025 through July 2026, which it notes in the release.
- Census says homeownership data from 2020 was affected by pandemic-era changes in data collection, so the 2020 spike in the chart should not be read as a market change.
- Third-quarter 2026 figures are scheduled for October 28, 2026; until then this page reflects the second quarter of 2026.
- This page does not forecast homeownership or rental demand.
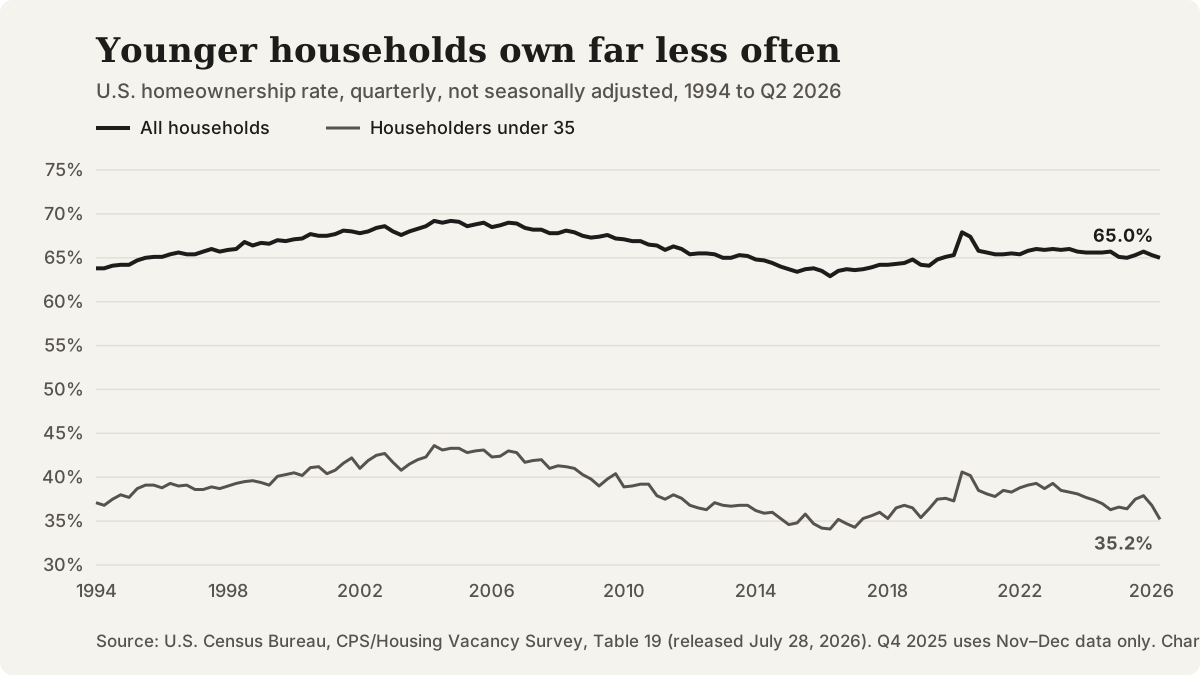
U.S. homeownership rate, all households and householders under 35, 1994 to Q2 2026. Source: U.S. Census Bureau, CPS/Housing Vacancy Survey.
Questions that come up
What is the homeownership rate?
The Census Bureau defines it as the share of occupied households that are owner-occupied: owner households divided by all occupied households.
Did the number of renter households grow this year?
The estimate rose by 450,000, but the Census Bureau's margin of error on that change is ±784,000, so the survey can't confirm any change. The count was about 46.83 million in the second quarter of 2026.
Should I use the seasonally adjusted rate?
As a general practice, adjusted rates suit quarter-to-quarter comparisons and unadjusted rates suit comparisons with the same quarter a year earlier. Census notes that adjusted rates for past quarters can change as new data arrive. In the second quarter of 2026 the adjusted rate was 65.2% and the unadjusted rate 65.0%.
When is the next update?
The Census Bureau has scheduled third-quarter 2026 figures for October 28, 2026. We plan to refresh this page after each quarterly release.
Sources and references
Follow each source to check the underlying claim. Access checks and professional review are different steps.