Research · introductory

Are repair and renovation costs going up?

Prices of goods used in home construction, construction wages and appliance prices from the Bureau of Labor Statistics, and what they mean for turnover, repair and capital budgets.
By Logan Piper, Aptoria's founder, who has managed residential rental property since age 13 and has owned since 21 · 5 min read · Updated 2026-10-23 · Last reviewed 2026-10-24
Technical content review: Claude technical editorial review. Every number re-fetched or recomputed against the cited source; derived figures recomputed independently; wording checked for overstatement, copying and fair-housing safety. Findings and resolutions are in the evidence file.
This is a technical review, not independent human or professional review.
Aptoria
In this resource
The short answer
The key numbers
How fast are construction goods prices rising?
Which materials are up the most?
Is labor getting more expensive?
What does that mean for a repair budget?
Sources and references
12
Revision history
1
Repair cost trends
In this resource
Research
1. The key numbers
All figures are national and run through September 2026, the latest month available on October 23, 2026. Producer price figures for June–September 2026 are preliminary and can be revised for up to four months.
2. How fast are construction goods prices rising?
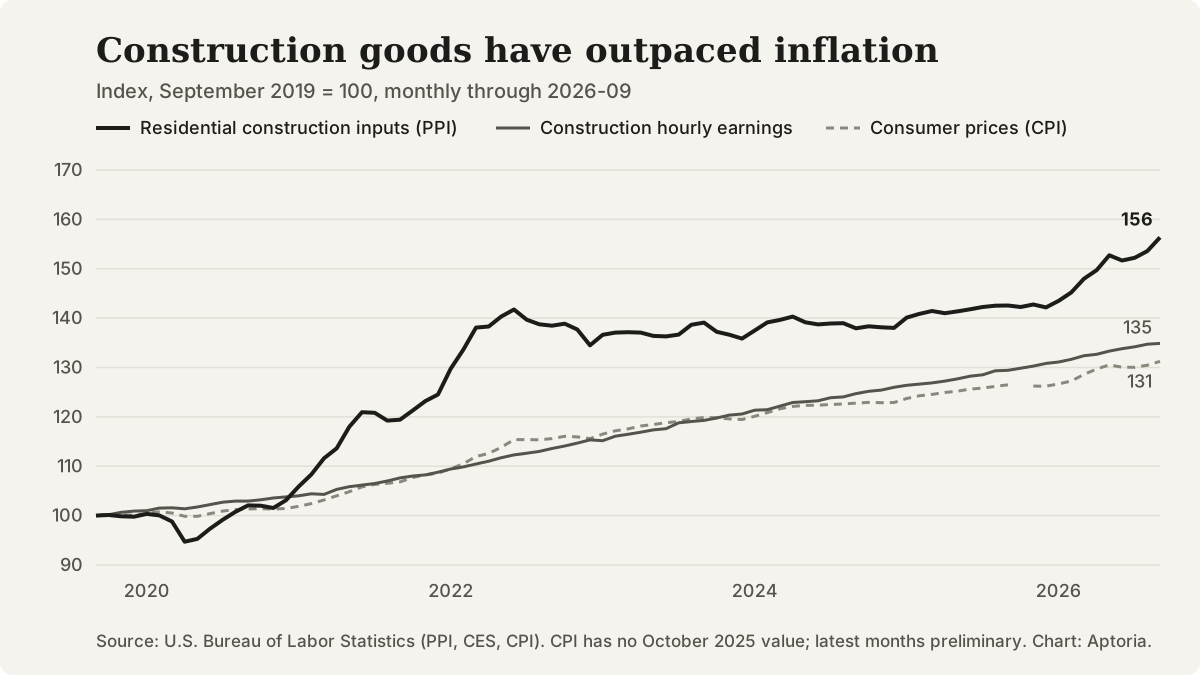
Faster than general inflation. The producer price index for goods used as inputs to residential construction rose 9.7% over the year to September 2026. The index itself is at its highest level in the data we pulled, which starts in 2019, and is 56.3% above September 2019. Consumer prices overall rose 3.7% over the year and 31.2% since September 2019.
3. Which materials are up the most?
Over the past year, softwood lumber rose the most of the items here (+14.2%), but it is volatile: it is still 50.4% below its May 2021 peak. Plumbing fixture fittings and trim rose 5.1% and prepared paint 5.0%. Gypsum products rose 1.4%.
4. Is labor getting more expensive?
Yes, steadily. Average hourly earnings for all construction employees were $41.69 in September 2026, up 4.2% from $40.01 a year earlier and 34.9% above September 2019 ($30.91). For production and nonsupervisory employees the figure was $39.20, up 4.3%. BLS marks the August and September 2026 earnings figures as preliminary.
5. What does that mean for a repair budget?
As a rough illustration, purchases that cost $5,000 in September 2019 and moved exactly with the construction inputs index would cost about $7,820 in September 2026, up from about $7,130 a year earlier. Your own costs will differ by item, supplier and market.
6. What this means for landlords
These are considerations to weigh against your own properties and quotes, not recommendations.
7. Methodology
We pull each series from the Bureau of Labor Statistics public data API with a script and compute every change from the published monthly values. Series titles were confirmed on each series' BLS page.
Repair cost trends
Format
Research
Difficulty
introductory
Reading time
5 min read
Updated
2026-10-23
Last reviewed
2026-10-24
Sources and references
12
In this resource
1. The key numbers
All figures are national and run through September 2026, the latest month available on October 23, 2026. Producer price figures for June–September 2026 are preliminary and can be revised for up to four months.
Key takeaways
Goods used in home construction cost 9.7% more than a year ago at the producer level, outpacing overall inflation of 3.7%.
Since September 2019 those inputs are up 56.3%, against 31.2% for consumer prices.
Average hourly earnings of construction employees rose 4.2% to $41.69.
The short answer
Yes. In September 2026, producer prices for goods used in home construction were 9.7% higher than a year earlier and 56.3% above September 2019, according to the Bureau of Labor Statistics. Average hourly earnings of construction employees rose 4.2%, slightly faster than consumer prices (3.7%). Appliance prices were roughly flat or lower.

Key takeaways

  • Goods used in home construction cost 9.7% more than a year ago at the producer level, outpacing overall inflation of 3.7%.
  • Since September 2019 those inputs are up 56.3%, against 31.2% for consumer prices.
  • Average hourly earnings of construction employees rose 4.2% to $41.69.
  • Appliance prices, not counting installation, are roughly flat to lower over the past year.

The key numbers

All figures are national and run through September 2026, the latest month available on October 23, 2026. Producer price figures for June–September 2026 are preliminary and can be revised for up to four months.
Repair and renovation cost measures, change to September 2026
MeasureOver the past yearSince September 2019Source
Goods used in residential construction (PPI)+9.7%+56.3%BLS PPI
Softwood lumber (PPI)+14.2%+31.3%BLS PPI
Gypsum products (PPI)+1.4%+54.1%BLS PPI
Plumbing fixture fittings and trim (PPI)+5.1%+35.8%BLS PPI
Prepared paint (PPI)+5.0%+50.6%BLS PPI
Household appliances (PPI)−0.3%+22.5%BLS PPI
Construction average hourly earnings ($41.69)+4.2%+34.9%BLS CES
Major appliances, consumer prices (CPI)−2.3%+3.8%BLS CPI
All consumer prices (CPI)+3.7%+31.2%BLS CPI

How fast are construction goods prices rising?

Faster than general inflation. The producer price index for goods used as inputs to residential construction rose 9.7% over the year to September 2026. The index itself is at its highest level in the data we pulled, which starts in 2019, and is 56.3% above September 2019. Consumer prices overall rose 3.7% over the year and 31.2% since September 2019.
Most of the climb since 2019 came in 2021 and the first half of 2022. The index then held roughly level until the past year, when it rose again (see the chart).
Producer prices measure what domestic producers receive for their output, for many products at the first commercial sale, not what you pay at a supply store or what a contractor charges. They show direction and scale, not your invoice.

Which materials are up the most?

Over the past year, softwood lumber rose the most of the items here (+14.2%), but it is volatile: it is still 50.4% below its May 2021 peak. Plumbing fixture fittings and trim rose 5.1% and prepared paint 5.0%. Gypsum products rose 1.4%.
The longer view looks different. Since September 2019, gypsum products are up 54.1% and paint 50.6%, while lumber is up 31.3%.
Appliances are the exception. The producer price index for household appliances was −0.3% over the year, and consumer prices for major appliances were −2.3%. Consumer appliance prices are only 3.8% above September 2019.

Is labor getting more expensive?

Yes, steadily. Average hourly earnings for all construction employees were $41.69 in September 2026, up 4.2% from $40.01 a year earlier and 34.9% above September 2019 ($30.91). For production and nonsupervisory employees the figure was $39.20, up 4.3%. BLS marks the August and September 2026 earnings figures as preliminary.
These are employees' earnings from the BLS payroll survey, not what a contractor bills you. Still, the trend in wages is a useful signal alongside materials.

What does that mean for a repair budget?

As a rough illustration, purchases that cost $5,000 in September 2019 and moved exactly with the construction inputs index would cost about $7,820 in September 2026, up from about $7,130 a year earlier. Your own costs will differ by item, supplier and market.
Illustrative: a construction-goods budget that moved exactly with the residential construction inputs index
Point in timeSame purchases would cost
September 2019$5,000
September 2025$7,130
September 2026$7,820

What this means for landlords

These are considerations to weigh against your own properties and quotes, not recommendations.
  • Current quotes may differ from last year's invoices. Producer prices for paint, plumbing fittings and lumber all rose over the past year.
  • A capital reserve set a few years ago may not reflect what construction goods and labor cost now; reserve calculators let you update it with your own numbers.
  • Asking for more than one quote, with materials and labor listed separately, makes bids easier to compare and shows which part changed.
  • For non-urgent projects, such as cosmetic upgrades, timing can matter more for volatile items like lumber.
  • Price trends are not a reason to put off urgent repairs. Problems affecting safety, water, heat or habitability are worth handling promptly.
  • Appliance prices, not counting installation, are flat to lower over the past year.

Methodology

We pull each series from the Bureau of Labor Statistics public data API with a script and compute every change from the published monthly values. Series titles were confirmed on each series' BLS page.
Changes over the past year compare September 2026 with the same month of 2025. Changes since 2019 compare with September 2019. The chart indexes each series to September 2019 = 100. Producer price and consumer price series are not seasonally adjusted; the earnings series are seasonally adjusted, as BLS publishes them.

Limitations

Keep these limits in mind.
  • Producer prices are not retail or contractor prices, and national figures hide local differences.
  • Construction earnings are not contractor billing rates.
  • Producer price figures for June–September 2026 are preliminary and can be revised for up to four months.
  • Consumer price data has no October 2025 value because of the 2025 federal funding lapse.
  • The BLS consumer price series for repair of household items was not used: its last published value is for July 2024.
  • Our data starts in 2019, so "highest" means highest since then.
  • This page does not forecast prices.
Line chart indexed to September 2019 = 100, monthly through 2026-09. The producer price index for inputs to residential construction (goods) rose to 156, construction average hourly earnings to 135, and consumer prices to 131. Construction inputs rose fastest, with a sharp jump in 2021 and 2022.
Producer prices for residential construction inputs, construction average hourly earnings and consumer prices, indexed to September 2019 = 100, through September 2026. Source: U.S. Bureau of Labor Statistics.

Questions that come up

What is the Producer Price Index?

It is a set of BLS indexes that track the prices domestic producers receive for their output, for many products at the first commercial sale. It shows how costs move upstream before they reach stores and contractors.

Are appliance prices going up?

Not over the past year. The producer price index for household appliances was −0.3% and consumer prices for major appliances were −2.3% in the year to September 2026.

How much should I budget for maintenance?

There is no single right number; it depends on the age and condition of the property and what you pay for. A maintenance budget calculator and a capital reserve calculator help you build one from your own numbers.

How often is this page updated?

We plan to refresh it after the monthly BLS producer price, consumer price and jobs releases. The updated date and revision history show what changed.

Sources and references

Follow each source to check the underlying claim. Access checks and professional review are different steps.
1. Primary source · U.S. Bureau of Labor Statistics
PPI Commodity data for Inputs to residential construction, goods, not seasonally adjusted
PPI for goods used as inputs to residential construction: monthly values 2019 through September 2026.
Source checked 2026-10-23
Automated source-access check: 2026-10-23.
2. Primary source · U.S. Bureau of Labor Statistics
PPI Commodity data for Lumber and wood products-Softwood lumber, not seasonally adjusted
PPI for softwood lumber: monthly values 2019 through September 2026.
Source checked 2026-10-23
Automated source-access check: 2026-10-23.
3. Primary source · U.S. Bureau of Labor Statistics
PPI Commodity data for Nonmetallic mineral products-Gypsum products, not seasonally adjusted
PPI for gypsum products: monthly values 2019 through September 2026.
Source checked 2026-10-23
Automated source-access check: 2026-10-23.
4. Primary source · U.S. Bureau of Labor Statistics
PPI Commodity data for Metals and metal products-Plumbing fixture fittings and trim, not seasonally adjusted
PPI for plumbing fixture fittings and trim: monthly values 2019 through September 2026.
Source checked 2026-10-23
Automated source-access check: 2026-10-23.
5. Primary source · U.S. Bureau of Labor Statistics
PPI Commodity data for Chemicals and allied products-Prepared paint, not seasonally adjusted
PPI for prepared paint: monthly values 2019 through September 2026.
Source checked 2026-10-23
Automated source-access check: 2026-10-23.
6. Primary source · U.S. Bureau of Labor Statistics
PPI Commodity data for Furniture and household durables-Household appliances, not seasonally adjusted
PPI for household appliances: monthly values 2019 through September 2026.
Source checked 2026-10-23
Automated source-access check: 2026-10-23.
7. Primary source · U.S. Bureau of Labor Statistics
Average hourly earnings of all employees, construction, seasonally adjusted
Average hourly earnings, all construction employees: monthly values 2019 through September 2026.
Source checked 2026-10-23
Automated source-access check: 2026-10-23.
8. Primary source · U.S. Bureau of Labor Statistics
Average hourly earnings of production and nonsupervisory employees, construction, seasonally adjusted
Average hourly earnings, production and nonsupervisory construction employees: monthly values 2019 through September 2026.
Source checked 2026-10-23
Automated source-access check: 2026-10-23.
9. Primary source · U.S. Bureau of Labor Statistics
Major appliances in U.S. city average, all urban consumers, not seasonally adjusted
CPI for major appliances: monthly values 2019 through September 2026.
Source checked 2026-10-23
Automated source-access check: 2026-10-23.
10. Primary source · U.S. Bureau of Labor Statistics
All items in U.S. city average, all urban consumers, not seasonally adjusted
CPI for all items: monthly values 2019 through September 2026.
Source checked 2026-10-23
Automated source-access check: 2026-10-23.
11. Primary source · U.S. Bureau of Labor Statistics
Producer Price Indexes
The PPI measures average changes in selling prices received by domestic producers, for many products at the first commercial transaction.
Source checked 2026-10-23
Automated source-access check: 2026-10-23.
12. Primary source · U.S. Bureau of Labor Statistics
Current Employment Statistics (CES), national
CES estimates employment, hours and earnings of workers on nonfarm payrolls by industry.
Source checked 2026-10-23
Automated source-access check: 2026-10-23.

Revision history

2026-10-23
First publication with BLS data through September 2026.
Report a correction to this resource