The short answer
Yes. Over the year to September 2026, consumer prices for electricity rose 4.4%, piped gas 5.0% and water, sewer and trash 4.8%, all faster than overall prices (3.7%). The average residential electricity price was 18.16¢ per kilowatt-hour in August 2026, with wide differences by state.
Key takeaways
The key numbers
CPI figures measure price changes for households, not the bill for any one building. EIA prices are averages across all residential customers. Both are national figures.
| Measure | Latest | Change | As of | Source |
|---|---|---|---|---|
| CPI: electricity | +4.4% a year | +42.8% since Sep 2019 | September 2026 | BLS |
| CPI: utility (piped) gas | +5.0% a year | +59.6% since Sep 2019 | September 2026 | BLS |
| CPI: water, sewer and trash | +4.8% a year | +36.4% since Sep 2019 | September 2026 | BLS |
| CPI: all items | +3.7% a year | +31.2% since Sep 2019 | September 2026 | BLS |
| Average residential electricity price | 18.16¢ per kWh | +3.4% from a year earlier | August 2026 (preliminary) | EIA |
| Average residential natural gas price | $26.45 per thousand cubic feet | +4.0% from a year earlier | July 2026 | EIA |
How much has electricity gone up?
The consumer price index for electricity rose 4.4% over the year to September 2026. EIA's average residential price was 18.16¢ per kilowatt-hour in August 2026, 3.4% more than a year earlier (17.57¢). EIA labels its 2026 figures preliminary.
Over a longer span the rise is steeper. EIA's annual average residential price went from 13.01¢ in 2019 to 17.23¢ in 2025, an increase of 32.4%. EIA's year-to-date average for January through August 2026 was 18.19¢, 6.8% above the same months of 2025 (17.03¢).
Which states have the highest electricity prices?
Prices differ widely by state. In August 2026 (preliminary), Hawaii had the highest average residential price at 47.18¢ per kWh, about 3.7 times the lowest. Excluding Hawaii, the highest (Maine, 32.11¢) was about 2.5 times the lowest. The lowest were Nevada (12.72¢), Louisiana (12.87¢) and North Dakota and Utah (13.31¢ each).
In those preliminary August 2026 figures, prices were higher than a year earlier in 44 of 51 states (counting the District of Columbia) and lower in 7. The largest increases were in Hawaii (+22.5%), Maine (+14.1%) and New Hampshire (+13.1%). One month is a snapshot, so compare several months before drawing conclusions about your state.
| State | August 2026 | A year earlier | Change |
|---|---|---|---|
| Hawaii | 47.18 | 38.53 | +22.5% |
| Maine | 32.11 | 28.14 | +14.1% |
| Massachusetts | 30.48 | 30.55 | −0.2% |
| Nevada | 12.72 | 12.54 | +1.4% |
| Louisiana | 12.87 | 12.55 | +2.5% |
| North Dakota | 13.31 | 12.97 | +2.6% |
| Utah | 13.31 | 13.62 | −2.3% |
Is natural gas getting more expensive?
Yes, on both measures. The CPI for utility (piped) gas service rose 5.0% over the year to September 2026. EIA's average residential natural gas price was $26.45 per thousand cubic feet in July 2026, 4.0% above a year earlier.
Residential gas prices swing with the seasons. Over the latest 12 months, EIA's monthly price ranged from $13.96 in January 2026 to $26.45 in July 2026, so compare the same month across years rather than consecutive months.
What about water, sewer and trash?
The CPI for water, sewer and trash collection services rose 4.8% over the year to September 2026, and 36.4% since September 2019. Rates differ by provider, so your local rate notices matter more than the national index.
How do utilities compare with overall inflation since 2019?
All three utility categories have risen faster than prices overall. From September 2019 to September 2026, the CPI for piped gas rose 59.6%, electricity 42.8% and water, sewer and trash 36.4%, compared with 31.2% for all items.
| Category | Change since September 2019 |
|---|---|
| Utility (piped) gas | +59.6% |
| Electricity | +42.8% |
| Water, sewer and trash | +36.4% |
| All items | +31.2% |
What this means for landlords
If you pay any utilities, for common areas, a master-metered building or units where utilities are included in rent, and your leases do not pass those costs through or reimburse them, price increases reduce your margin until you can reprice. These are considerations, not recommendations.
- Budgeting from current rates gives a more realistic picture than last year's totals. In the illustrative example below, $5,400 of owner-paid utilities becomes about $5,658 at the latest national pace, though prices fell in some states.
- Who pays what can differ from lease to lease. Where utilities are included in rent, your actual bills are part of what a renewal offer is pricing.
- If you allocate utility costs to tenants, for example with a ratio utility billing system (RUBS), rules vary by state and locality. Check the rules that apply to your property before changing how you bill.
- If common-area electricity is on its own meter, compare that bill month over month and year over year, not just against the national average.
- Your local utility's rate filings and notices are the best guide to what is coming; national indexes describe the past.
What changed in this update
First published October 23, 2026.
Methodology
We pull the BLS consumer price indexes through the BLS public data API and EIA's electricity and natural gas price tables from EIA's website with a script, then compute each change from those values. CPI series are U.S. city average, all urban consumers, not seasonally adjusted. Year-over-year changes compare the same month a year apart.
EIA reports residential electricity prices in cents per kilowatt-hour and natural gas prices in dollars per thousand cubic feet. The electricity year-to-date comparison uses EIA's own year-to-date averages from Table 5.3. EIA's next natural gas price release, which will add August 2026 data, is scheduled for October 30, 2026, and EIA's next Electric Power Monthly release (Tables 5.3 and 5.6.A) for November 24, 2026. We plan to refresh this page after each.
Limitations
Keep these limits in mind.
- CPI and EIA averages describe households nationally or by state, not commercial accounts or your building's rate class.
- EIA's 2026 electricity figures are preliminary and may be revised.
- BLS lists October 2025 CPI values as unavailable because of the 2025 lapse in appropriations, so monthly series have a gap.
- Price changes are not bill changes: usage, weather and rate structures also move what you pay.
- The budget example is hypothetical.
- This page does not forecast utility prices.
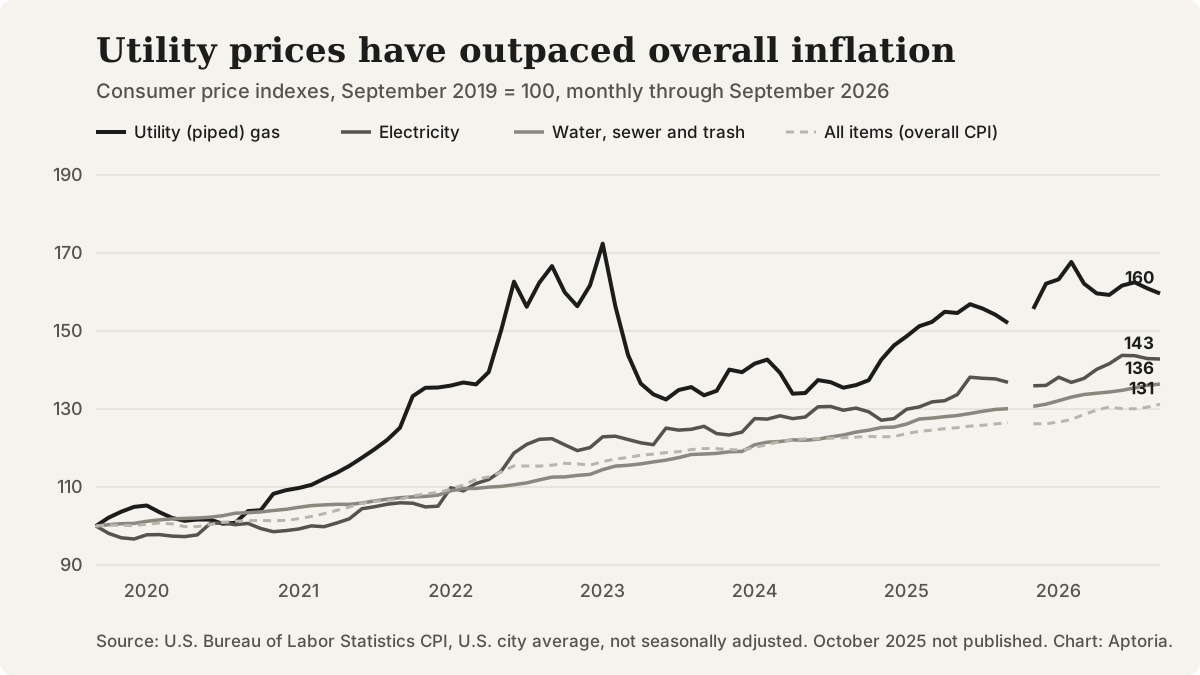
CPI for piped gas, electricity, water/sewer/trash and all items, September 2019 = 100, through September 2026. Source: U.S. Bureau of Labor Statistics.
Questions that come up
Why do utility costs rise faster than other prices?
This page reports how much prices changed, not why. Your utility's rate notices or filings explain the changes that apply to you.
What does cents per kilowatt-hour mean?
It is the average price per kilowatt-hour that residential customers paid, as EIA calculates it, including delivery charges. The U.S. average was 18.16 cents in August 2026. Multiplying by your monthly kilowatt-hours gives a rough comparison point, not your exact bill.
Does this page cover heating oil or propane?
No. It covers electricity, piped natural gas, and water, sewer and trash. For buildings heated with oil or propane, those fuels' own price data is the better guide.
How often is this page updated?
We plan to refresh it after new CPI and EIA releases, and the revision history lists what moved.
Sources and references
Follow each source to check the underlying claim. Access checks and professional review are different steps.