The short answer
Figures derived from Census data show about 79,000 single-family homes started as rentals in 2025, 8.4% of single-family starts, down from 93,000 in 2024, a drop that may not be statistically significant. About 104,000 were completed. The South had 57% of the starts. Multi-unit buildings still dominate: 392,000 units were started for rent in them.
Key takeaways
The key numbers
These figures come from the Census Bureau's quarterly purpose-and-design tables, released August 18, 2026 with HUD. Annual totals are used where possible; Census notes that quarterly estimates may not add up to the annual figures.
| Measure | Latest | Earlier | Period |
|---|---|---|---|
| Single-family homes started as rentals | 79,000 | 93,000 in 2024 | 2025 |
| Share of all single-family starts | 8.4% | 9.2% in 2024 | 2025 |
| Single-family homes completed as rentals | 104,000 | 113,000 in 2024 | 2025 |
| Units started for rent in buildings with 2+ units | 392,000 | 331,000 in 2024 | 2025 |
| Single-family share of all units started for rent | 16.8% | 21.9% in 2024 | 2025 |
| Single-family rental starts, latest quarter (preliminary) | 15,000 | 16,000 a year earlier | Q2 2026 |
How many single-family homes are built to rent?
Between 79,000 and 93,000 a year from 2023 to 2025. Derived from Census data, about 90,000 single-family homes were started as rentals in 2023, 93,000 in 2024 and 79,000 in 2025. That is between 8.4% and 9.5% of all single-family starts.
Completions, the homes finished during the year, were higher: 104,000 in 2025, or 10.3% of single-family completions, after 113,000 in 2024.
Census defines a house built for rent as one built on the builder's land with the intention of renting it. A lease-purchase or other option to buy may exist, and retirement community units under life-lease arrangements are included. Single-family includes detached houses and attached homes such as townhouses, as long as each unit is separated by a ground-to-roof wall, has its own heating system and utility meters, and has no unit above or below.
The figure counts homes the builder intends to rent. Under Census definitions, a new home built to be sold counts as built for sale even if an investor or rental company buys it and rents it out, so this figure does not capture every new single-family home that ends up as a rental.
| Year | Started | Share of single-family starts | Completed | Share of single-family completions |
|---|---|---|---|---|
| 2023 | 90,000 | 9.5% | 97,000 | 9.7% |
| 2024 | 93,000 | 9.2% | 113,000 | 11.1% |
| 2025 | 79,000 | 8.4% | 104,000 | 10.3% |
Is build-to-rent growing or shrinking?
Starts fell in 2025 by this measure. Single-family rental starts were 15.1% lower than in 2024, a steeper drop than the 7.2% decline in all single-family starts. Completions fell 8.0%.
Treat that decline with caution. Census publishes no sampling error for the rental figure, and the categories subtracted to get it carry wide ones: at 90% confidence, 2025 built-for-sale starts are uncertain by about 32,000 either way, owner-built starts by about 13,000 and contractor-built starts by about 19,000. So the drop from 2024 may not be statistically significant.
The latest quarters are less clear. Adding up the quarterly figures, about 63,000 single-family rental homes were started from Q3 2025 to Q2 2026, against 75,000 in the four quarters before (−16.0%). Each four-quarter total can be off by up to 8,000 from rounding, so that decline is not certain. In the second quarter of 2026, a preliminary estimate, the figure was 15,000, about the same as the 16,000 a year earlier, a difference within rounding.
The quarterly tables give a lower rental figure than the annual table: the four quarters of 2025 add to 67,000, against 79,000 for the year. Total single-family starts match (940,000 from the quarters and 940,000 for the year), so the difference is in the purpose split: quarterly built-for-sale figures add to 686,000, against 675,000 in the annual table. Census's table note says: “Quarterly estimates may not add to the annual figures as the latter include late reports and corrections.” Compare quarters with quarters, and years with years.
Where are build-to-rent homes going up?
Mostly in the South. Of the 79,000 single-family rental starts in 2025, 45,000 (57.0%) were in the South and 20,000 (25.3%) in the West. The Northeast had about 3,000.
As a share of each region's single-family starts, the estimates were 9.9% in the West, 8.3% in the South, 8.3% in the Midwest and 4.7% in the Northeast. These are small numbers rounded to the nearest thousand, so the differences between regions may not be meaningful.
| Region | Started as rentals | Share of national total | Share of the region's single-family starts |
|---|---|---|---|
| South | 45,000 | 57.0% | 8.3% |
| West | 20,000 | 25.3% | 9.9% |
| Midwest | 11,000 | 13.9% | 8.3% |
| Northeast | 3,000 | 3.8% | 4.7% |
How does this compare with new apartments?
Single-family homes are a minority of new rental construction. In 2025, 392,000 units in buildings with two or more units were started for rent, +18.4% from 2024. Single-family homes made up 16.8% of all units started for rent, down from 21.9% in 2024.
Nearly all units started in multi-unit buildings are rentals: 94.2% of those started in 2025.
What this means for landlords
These are considerations to weigh against your own market, not recommendations.
- Most new single-family rentals are in the South and West (82% in 2025), but so is most single-family building (79% of all single-family starts). If a new rental community opens near your property, include its listings when you check comparable rents.
- When you price a unit, compare it with recent leases and listings of similar age and condition, not only with new construction. Consider whether new rental houses nearby are closer competition for your tenants than new apartment buildings.
- When tenants have more choices nearby, compare the cost of a vacancy and turnover with the extra rent from a higher ask.
- The national estimate fell in 2025, though the change may not be statistically significant, and local pipelines can differ. Local permit and planning records show what is coming to your area.
What changed in this update
First published October 23, 2026, with Census data released August 18, 2026. Future updates will list what moved.
Methodology
Census does not publish single-family homes built for rent as its own column. Its table note says the single-family total includes them, so we subtract homes built for sale, contractor-built homes and owner-built homes from the total. Each published figure is rounded to the nearest thousand, so a single period's result can be off by up to 2,000 units.
We pull the Census PDF and extract its tables with a script, then compute every share and change. Units for rent in buildings with two or more units are published directly. Census releases these tables quarterly with its housing starts report; the next release, with third-quarter 2026 data, is scheduled for November 18, 2026.
Limitations
Keep these limits in mind.
- The single-family built-for-rent figure is derived, not published, and inherits rounding from four published numbers.
- Survey estimates carry sampling error. For U.S. single-family starts in 2025, Census lists relative standard errors (RSEs) of 1% for the total, 9% for contractor-built and 15% for owner-built homes; for completions, 2% and 14% for the total and owner-built. Census's methodology describes a 90% range as about 1.6 RSEs on each side of an estimate. It publishes no RSE for the derived rental figure.
- Census revises these tables. This page uses the table released August 18, 2026, so other publications may show different figures for the same quarter.
- Quarterly rental figures do not add up to the annual rental totals, and the latest quarter is preliminary.
- This file covers 2023 through Q2 2026 only, so this page does not show the longer history.
- Regional estimates are small and do not show metro or county detail.
- This page does not forecast construction.
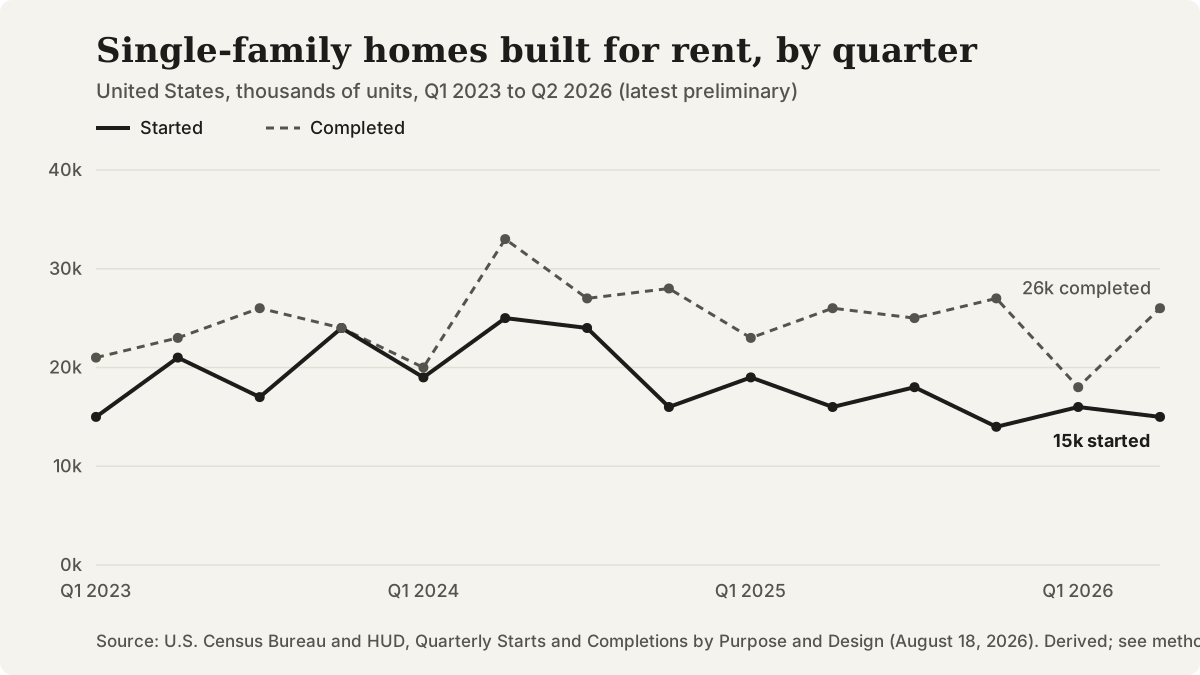
Single-family homes built for rent, started and completed, by quarter, Q1 2023 to Q2 2026 (latest preliminary). Derived from Census purpose-of-construction tables released August 18, 2026.
Questions that come up
What counts as built for rent in Census data?
A house built on the builder's land with the intention of renting it. A lease-purchase or other option to buy may exist, and retirement life-lease units are included. Homes built for an owner to live in, or built for sale, are counted separately.
Are townhouses included?
Yes, if they meet Census's single-family rules: each unit is separated by a ground-to-roof wall, has its own heating system and utility meters, and has no unit above or below.
When will these numbers be updated?
Census publishes the next quarterly purpose-and-design tables, with third-quarter 2026 data, on November 18, 2026. We plan to refresh this page after that release.
Does this include homes that investors buy and rent out?
No. Existing homes are not new construction, and a new home the builder intends to sell counts as built for sale under Census definitions, even if an investor or rental company buys it. The figure covers only homes the builder intends to rent.
Sources and references
Follow each source to check the underlying claim. Access checks and professional review are different steps.