The short answer
In 2023 there were 60,818 residential property management establishments with paid staff, employing 536,933 people, according to the Census Bureau. Separately, BLS counted 311,180 property, real estate and community association managers on payrolls in May 2025, with a median annual wage of $69,990. Including the self-employed, BLS puts the occupation at about 460,400 jobs.
Key takeaways
The key numbers
These figures come from two federal sources that measure different things. Census counts business locations with paid staff and everyone on their payrolls; BLS counts workers in one occupation, wherever they work. The two should not be added together or treated as the same total.
| Measure | Value | Year | Source |
|---|---|---|---|
| Residential property management establishments with paid employees | 60,818 | 2023 | Census CBP |
| Employees at those establishments (all jobs) | 536,933 | 2023 | Census CBP |
| Annual payroll at those establishments | $31.6 billion | 2023 | Census CBP |
| Property, real estate and community association managers (wage and salary) | 311,180 | May 2025 | BLS OEWS |
| Median annual wage for those managers | $69,990 | May 2025 | BLS OEWS |
| Jobs in the occupation, including self-employed | 460,400 | 2025 | BLS projections |
| Projected change in those jobs, 2025 to 2035 | +4% (17,100) | 2025–2035 | BLS projections |
How many residential property management businesses are there?
Census County Business Patterns counted 60,818 establishments in NAICS 531311, Residential Property Managers, in 2023. An establishment is a single business location, so a company with several offices counts more than once. The count rose every year from 49,655 in 2017, an increase of 22.5% by our calculation.
Those establishments employed 536,933 people in the week of March 12, 2023, up 19.8% from 448,199 in 2017. That was more than twice the 8.7% growth in employment across all industries covered by the same survey. Employment was little changed between 2020 and 2021 and rose in the other years.
The employee count covers everyone on these businesses' payrolls, such as leasing, maintenance and office staff, not only managers. Annual payroll was $31.6 billion, or about $58,786 per employee by our calculation (annual payroll divided by mid-March employment), not adjusted for inflation. Managers of nonresidential property (NAICS 531312) are counted separately: 18,068 establishments and 170,788 employees in 2023.
| Year | Establishments | Employees | Annual payroll |
|---|---|---|---|
| 2017 | 49,655 | 448,199 | $19.7 billion |
| 2018 | 50,986 | 459,641 | $20.9 billion |
| 2019 | 52,854 | 470,278 | $22.4 billion |
| 2020 | 54,158 | 486,758 | $23.7 billion |
| 2021 | 55,347 | 485,256 | $25.6 billion |
| 2022 | 57,435 | 507,375 | $29.4 billion |
| 2023 | 60,818 | 536,933 | $31.6 billion |
Are most property management businesses small?
By location, yes. In 2023, 64.9% of residential property management establishments had fewer than five employees in mid-March, a group that includes locations with no employees that week but paid staff at some point in the year, and 85.0% had fewer than 10.
Employment is more concentrated. The 704 establishments with 100 or more employees, 1.2% of the total, accounted for 34.8% of the industry's employees. Because the data describe locations rather than companies, they cannot show how many separate companies there are or how much of the market the largest firms hold.
| Employees at the establishment | Establishments | Share of establishments | Employees | Share of employees |
|---|---|---|---|---|
| Fewer than 5 | 39,481 | 64.9% | 68,277 | 12.7% |
| 5 to 9 | 12,213 | 20.1% | 78,569 | 14.6% |
| 10 to 19 | 4,979 | 8.2% | 65,793 | 12.3% |
| 20 to 49 | 2,547 | 4.2% | 75,343 | 14.0% |
| 50 to 99 | 894 | 1.5% | 62,235 | 11.6% |
| 100 to 249 | 507 | 0.8% | 76,869 | 14.3% |
| 250 to 499 | 133 | 0.2% | 45,042 | 8.4% |
| 500 to 999 | 50 | 0.1% | 33,434 | 6.2% |
| 1,000 or more | 14 | 0.0% | 31,371 | 5.8% |
What do property managers earn?
The median annual wage for property, real estate and community association managers was $69,990 in May 2025 ($33.65 an hour), about 37% above the $50,980 median for all occupations by our calculation. The mean was $83,710.
Pay varies widely. The lowest-paid 10% earned less than $41,010 and the highest-paid 10% more than $139,680.
The BLS occupation is broader than residential management. Its definition covers managers of commercial, industrial and residential real estate, including homeowner and condominium association managers, with apartment managers among the examples. About four in five of these managers on payrolls, 252,840 or 81.3% by our calculation, worked in the real estate industry, where their median wage was $64,290. BLS does not publish a separate wage for managers working at residential property management firms in these files.
| Measure | Annual wage |
|---|---|
| 10th percentile | $41,010 |
| 25th percentile | $50,720 |
| Median | $69,990 |
| 75th percentile | $97,910 |
| 90th percentile | $139,680 |
| Mean | $83,710 |
| Median, all occupations | $50,980 |
How many property managers are there?
It depends on who is counted. The OEWS survey counted 311,180 wage and salary jobs in the occupation in May 2025. It does not include self-employed workers.
BLS's employment projections put the occupation at about 460,400 jobs in 2025, a count that includes self-employed workers, who made up 31% of the total. The real estate industry accounted for 56% in that count.
Neither count is the same as the Census employee total above, which includes every worker at residential property management businesses and excludes the self-employed and managers who work in other industries.
Where do property managers work and earn the most?
California, Texas and Florida had the most property, real estate and community association managers on payrolls in May 2025, together about 40% of the national total by our calculation. Relative to all jobs, the occupation was most common among states in Nevada (3.6 per 1,000 jobs), followed by Texas (3.2), and Arizona and Hawaii (3.1 each).
The median wage was highest in Washington ($119,320), Massachusetts ($103,410) and Colorado ($100,080), and lowest in Arkansas ($47,760), South Dakota ($49,490) and Louisiana ($49,990). In Washington and Colorado, two of the highest-paying states, the occupation was relatively small, under one job per 1,000. We did not find a BLS explanation for the pattern, so this page does not attribute a cause.
State estimates come from a sample. BLS's relative standard error for state employment ranged up to 16.7%, and BLS does not publish an error measure for medians, so small differences between states may not be meaningful.
| State | Employment | Jobs per 1,000 jobs | Median annual wage |
|---|---|---|---|
| California | 50,040 | 2.7 | $77,030 |
| Texas | 45,350 | 3.2 | $61,320 |
| Florida | 30,160 | 3.0 | $70,810 |
| New York | 11,390 | 1.2 | $99,390 |
| Illinois | 11,180 | 1.8 | $74,980 |
| North Carolina | 10,690 | 2.2 | $61,430 |
| Arizona | 9,970 | 3.1 | $63,740 |
| Ohio | 9,960 | 1.8 | $59,050 |
| Pennsylvania | 9,370 | 1.5 | $65,680 |
| Georgia | 8,690 | 1.8 | $75,380 |
Is the occupation expected to grow?
BLS projects employment in the occupation to grow 4% from 2025 to 2035, to about 477,600 jobs, which it describes as about as fast as the 3% average for all occupations. It projects about 36,900 openings a year over the decade, many of them to replace workers who move to other occupations or leave the labor force, for example to retire.
This is BLS's projection, not ours, and this page does not forecast demand for property managers.
What this means for landlords
These are considerations to weigh against your own situation, not financial, legal or employment advice.
- If you hire an on-site or salaried manager, the national wage range ($50,720 at the 25th percentile to $97,910 at the 75th) and your state's median are a starting reference. Local pay can differ a lot from the national figure.
- If you are choosing a management company, most residential property management locations are small offices. It may be worth asking any company how many staff will handle your property and who covers after-hours calls.
- These are wages and payroll, not management fees. Fees are set by contract and are not measured in these federal data; the property management cost calculator lets you test fees under your own assumptions.
- If you are weighing self-management against hiring, our page on who owns rental housing shows how common self-management is among rental properties.
- A growing industry says nothing about the quality of any one manager. References, a written agreement and clear reporting matter more for your property.
Methodology
Business counts come from the Census Bureau's County Business Patterns national files for 2017 to 2023, using the all-legal-forms rows for NAICS 531311 (Residential Property Managers), 531312 and all industries. Employment refers to the week of March 12, and annual payroll is reported in thousands of dollars. Shares, changes and payroll per employee are our calculations. We start the trend in 2017 because the 2017 to 2023 files all use the same industry classification edition.
Occupation figures come from BLS's May 2025 Occupational Employment and Wage Statistics national, state and industry files for SOC 11-9141, and from BLS's 2025 to 2035 employment projections as shown in the Occupational Outlook Handbook. BLS blocked scripted downloads on 2026-10-24, so we fetched the BLS files in a browser from bls.gov, extracted the rows and sentences used, and recorded a hash of each source file so the extract can be checked. Figures are rounded once, at display.
Limitations
Keep these limits in mind.
- Census County Business Patterns excludes self-employed people and most government employees, so one-person management businesses without employees are not in the establishment counts.
- Census adds noise to protect confidentiality. The 2023 national employment and payroll totals used here are flagged as changed by less than 2%; the employment count for the 5-to-9-employee class is flagged as changed by 2% to 5%, so size-class shares are approximate.
- An establishment is a location, not a company, so the counts say nothing about how many companies there are or how large the biggest firms are.
- BLS does not encourage using OEWS data as a time series, so this page reports only the May 2025 wage and employment estimates and does not compare them with earlier years.
- The BLS occupation includes commercial, industrial and community association managers as well as residential managers.
- 2023 is the latest County Business Patterns year. Census's methodology page says it is evaluating alternative approaches to comply with a Commerce Department administrative order prohibiting noise infusion, and it gives no date for the next release.
- Dollar figures are not adjusted for inflation.
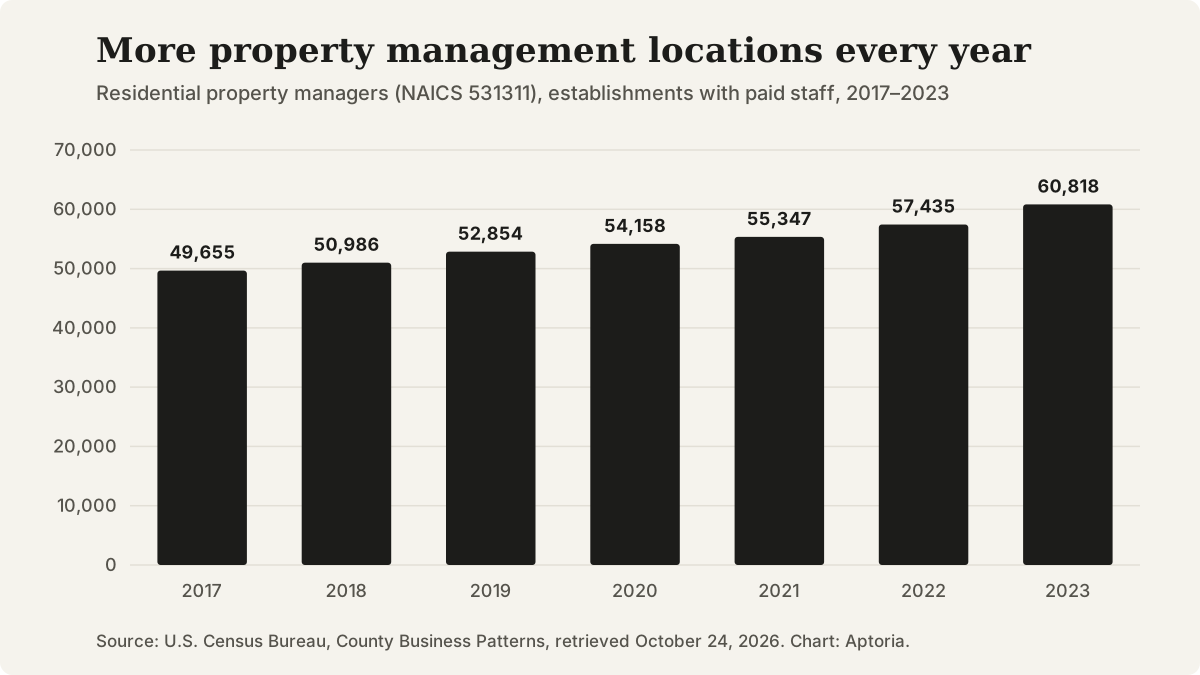
Residential property management establishments (NAICS 531311) with paid employees, 2017 to 2023. Source: U.S. Census Bureau, County Business Patterns.
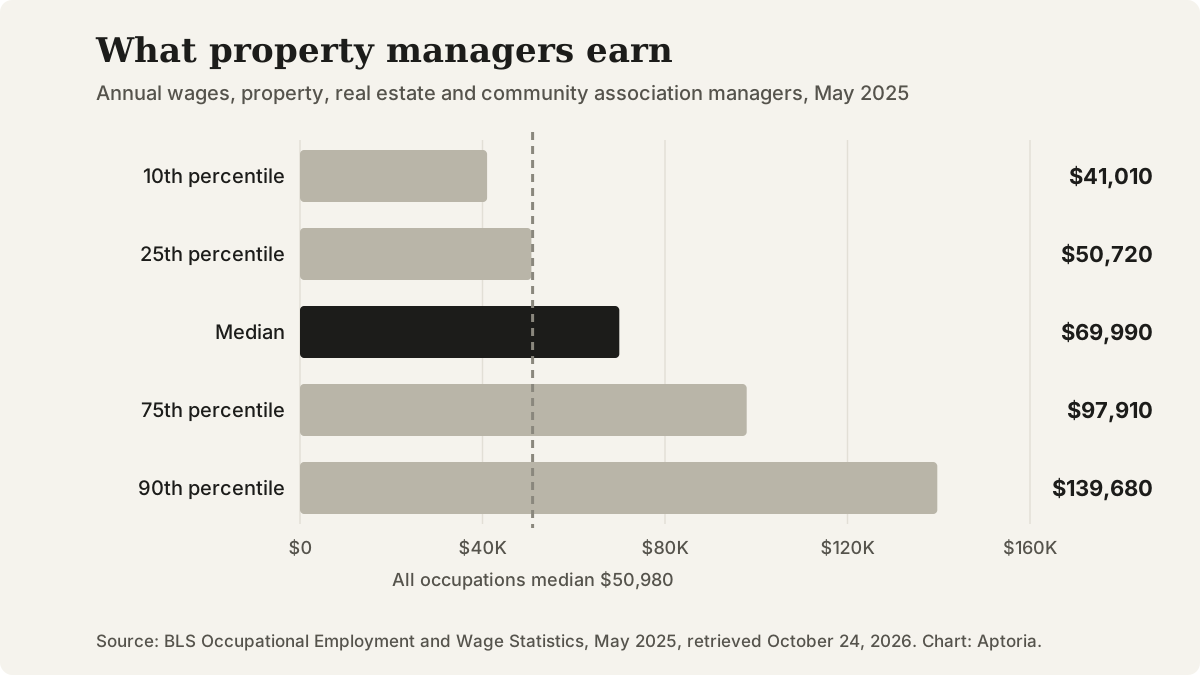
Annual wage percentiles for property, real estate and community association managers, May 2025, with the median for all occupations. Source: BLS Occupational Employment and Wage Statistics.
Questions that come up
Does this page show what property management companies charge?
No. The federal sources used here measure businesses, employment, payroll and wages, not the fees managers charge owners. Fees are set by contract and vary by market and service.
Are HOA and condo association managers included?
In the BLS occupation figures, yes: the occupation's definition includes managers of homeowner and condominium associations. The Census business counts on this page cover only residential property management businesses.
When will newer figures be available?
BLS released the May 2025 occupation estimates on May 15, 2026. BLS had not announced a date for the next set in the sources used here. Census has not given a date for 2024 County Business Patterns data.
Does this page forecast demand for property managers?
No. The growth figure on this page is BLS's own 2025 to 2035 projection, reported as BLS published it.
Sources and references
Follow each source to check the underlying claim. Access checks and professional review are different steps.