The short answer
Mostly individuals if you count properties, but not if you count units. In the Census Bureau's 2024 Rental Housing Finance Survey, individual investors, including couples, owned about 59% of the nation's 19.0 million rental properties but about 32% of its 49.7 million rental units. LLCs, LPs and LLPs owned 21% of properties and 43% of units.
Key takeaways
The key numbers
Owner type is how the owner or manager described the current ownership entity when the survey asked. Shares are our tabulations of the Census public use file; totals are Census's published figures.
Owner type was not reported for about 8% of properties and 11% of units, so the named groups add to less than 100%.
| Owner type | Share of rental properties | Share of rental units |
|---|---|---|
| Individual investors, including couples and other joint owners | 58.9% (±6.3) | 31.6% (±2.7) |
| LLCs, LPs and LLPs | 21.4% (±3.3) | 43.0% (±1.9) |
| Trustee for estate | 6.3% (±4.5) | 3.8% (±1.8) |
| General partnerships and tenants in common | 0.3% (±0.2) | 1.5% (±0.3) |
| Real estate corporations | 0.7% (±0.2) | 3.0% (±0.7) |
| Real estate investment trusts (REITs) | 1.0% (±1.5) | 1.3% (±0.6) |
| Nonprofit organizations | 0.6% (±0.6) | 2.1% (±0.5) |
| Housing cooperatives | 0.1% (±under 0.1) | 0.4% (±0.1) |
| Other institutions | 2.4% (±1.3) | 2.4% (±0.7) |
| Not reported | 8.2% (±2.9) | 10.8% (±1.7) |
| Total (Census published) | 18,965 thousand properties | 49,722 thousand units |
Why do properties and units tell different stories?
Because most rental properties are small and most units are in large ones. Census counts 82.9% of rental properties as single-unit properties, but those hold 31.6% of rental units. Properties with 50 or more units are 0.4% of properties and 39.2% of units.
Individual investors are concentrated at the small end. About 99% of the properties they own have one to four units. In properties with 50 or more units, individuals own about 5% of properties, while LLCs, LPs and LLPs own about 64%.
A property, in this survey, is all the units and buildings owned and financed together. An apartment complex with several buildings counts once if its buildings are owned and financed together.
| Units in the property | Properties (thousands) | Share of properties | Units (thousands) | Share of units |
|---|---|---|---|---|
| 1 unit | 15,714 (±239) | 82.9% | 15,714 (±239) | 31.6% |
| 2 to 4 units | 2,766 (±126) | 14.6% | 7,704 (±224) | 15.5% |
| 5 to 24 units | 330 (±15) | 1.7% | 4,091 (±61) | 8.2% |
| 25 to 49 units | 74 (±3) | 0.4% | 2,708 (±69) | 5.4% |
| 50 or more units | 81 (±3) | 0.4% | 19,505 (±356) | 39.2% |
Does an LLC owner mean a large company?
Not usually, by these measures. About 94% of LLC-, LP- and LLP-owned rental properties have one to four units. About 26% belong to an entity that owns no other residential rental property, and about 69% to one that owns 10 or fewer others, though that last estimate has a wide margin of error (±17 points).
The survey records the entity, not the people behind it, and one investor can own through more than one entity. Many LLC-owned rentals are small properties held by entities with few other rentals, but the survey cannot show how many of the people behind those entities are small owners.
How many rentals belong to large portfolio owners?
A small share by property count. About 77% of rental properties belong to an entity with 10 or fewer other residential rental properties, covering about 65% of units. Entities with more than 100 other rental properties own about 0.7% of properties but about 5% of units.
Real estate investment trusts own about 1% of rental properties and about 1% of units nationally. Both estimates are small and imprecise.
| Other rental properties owned | Share of rental properties | Share of rental units |
|---|---|---|
| None | 40.7% (±5.9) | 36.9% (±2.7) |
| 1 to 10 | 36.2% (±8.2) | 28.2% (±3.4) |
| 11 to 100 | 12.4% (±4.1) | 17.7% (±1.9) |
| More than 100 | 0.7% (±0.4) | 4.8% (±0.7) |
| Owns others, number not reported | 1.2% (±1.3) | 2.5% (±0.7) |
| Not reported | 8.7% (±2.9) | 10.0% (±1.5) |
Who manages rental properties day to day?
About half of rental properties (53%) are managed day to day by the owner or an unpaid agent such as a family member. Management companies handle about 22%, and managers employed directly by the owner about 15%.
Self-management is most common in two- to four-unit properties, at about 75%, higher than the 50% for single-unit properties. It falls to about 8% in properties with 50 or more units. Among properties owned by individual investors, about 62% are self-managed.
Counted by units, roughly a third are in self-managed properties (33%) and a third in properties run by management companies (35%); the difference is within the margin of error.
Owners or their unpaid agents who manage single-unit rentals reported a median of about 5 hours a month on management. For two- to four-unit properties the median was about 8 hours, with a wide margin (±5 hours).
| Units in the property | Individual investor owner | LLC, LP or LLP owner | Managed by owner or unpaid agent | Management company | Mortgage or similar debt |
|---|---|---|---|---|---|
| All properties | 58.9% (±6.3) | 21.4% (±3.3) | 53.4% (±6.5) | 21.6% (±5.6) | 34.3% (±5.0) |
| 1 unit | 59.6% (±7.5) | 20.6% (±3.9) | 50.5% (±7.8) | 22.3% (±6.7) | 31.9% (±5.9) |
| 2 to 4 units | 61.7% (±6.2) | 20.8% (±4.2) | 74.6% (±5.5) | 14.3% (±4.6) | 45.1% (±7.4) |
| 5 to 24 units | 23.2% (±5.0) | 48.2% (±3.3) | 37.0% (±6.8) | 35.5% (±3.4) | 47.0% (±3.4) |
| 25 to 49 units | 5.6% (±1.9) | 63.5% (±4.5) | 16.8% (±4.2) | 40.5% (±8.4) | 53.4% (±7.3) |
| 50 or more units | 5.4% (±1.3) | 64.0% (±2.2) | 7.8% (±2.0) | 49.1% (±2.2) | 53.3% (±2.6) |
How many rental properties have a mortgage?
Most do not. Census estimates 6.5 million rental properties (34%) had a mortgage or similar debt and 10.8 million (57%) had none; status was not reported for 1.6 million. Because larger properties carry debt more often, about 45% of units are in properties with debt.
Debt is less common on single-unit rentals (32%) than on two- to four-unit properties (45%). About 38% of individual-investor properties have debt, an estimate with a margin of ±10 points.
The survey's question counts construction loans, blanket loans, private investor loans, seller financing, home equity loans and lines of credit, and bond-financed mortgages, not only conventional first mortgages.
What this means for landlords
These are considerations to weigh against your own properties, not financial, legal or tax advice.
- If you own a one- to four-unit rental and manage it yourself, your property looks like a large share of the rental properties in this survey. Benchmarks drawn from large apartment operators may not match how your property runs.
- If you are comparing self-management with hiring a manager, a few months of your own time log is a fairer basis than a national median. The survey's medians are a rough reference point.
- Without a mortgage, no lender collects property taxes with a monthly payment. Even among properties with debt, about 46% (±13 points) said the regular payment on the first loan includes property taxes and about 33% (±13) said it does not; the rest (about 21%) did not know, did not answer or had no regular payment. Answers on whether the payment includes property insurance were nearly the same (46% yes, 33% no). If your payment does not include them, property taxes and insurance need a place on your own calendar.
- National shares can hide local differences. Investor activity in one metro or neighborhood can look very different from these totals.
Methodology
We downloaded the 2024 Rental Housing Finance Survey public use file (version 1.0, released February 19, 2026; 4,425 completed interviews) and tabulated it with a script using Census's final property weight. Margins of error are 90% intervals from the file's 100 replicate weights, using the successive difference replication method Census describes.
Before using the file, the script checks that it reproduces Census's published estimates: 18,965 thousand properties (±271 thousand), the counts with, without and with unreported mortgage status and their margins, and property counts by size. All match.
Shares include not-reported answers in the denominator, so each set adds to 100%. Owner type, management, hours and other properties come from survey items 18, 15a, 15b, 18a and 18b; mortgage status from item 24a; whether the loan payment includes property taxes or insurance from item 35d_1. Size counts, total units and mortgage counts are Census's published figures. Every other share is our calculation.
Statements that one share is larger than another were checked against replicate standard errors at the 90% level. Figures are rounded once, at display.
Limitations
Keep these limits in mind.
- Census reports an average unit response rate of 45.1%. Weights are adjusted for nonresponse, but owners who did not respond may differ from those who did.
- The sample was drawn from the 2021 American Housing Survey, so rental properties built from late 2020 onward are not included. Census notes that roughly 340,000 to 350,000 rental units in properties with two or more units were built in each of 2020, 2021 and 2022. Public housing is excluded.
- Owner type is self-described. The survey cannot see who controls an LLC, partnership or trust.
- Unit-based shares use the public file's topcoded unit counts, which sum to about 49.9 million units, 0.35% above Census's published total. The gap is in properties with 50 or more units.
- Several subgroup estimates have wide margins of error, and the hours medians come from rounded, self-reported answers. Treat them as approximate.
- This page does not compare the 2024 survey with earlier editions. The 2021 public use file was revised in September 2026, and each edition is drawn from a different sample.
- Figures are national. The survey does not publish ownership shares by state or metro.
- This page does not forecast ownership trends.
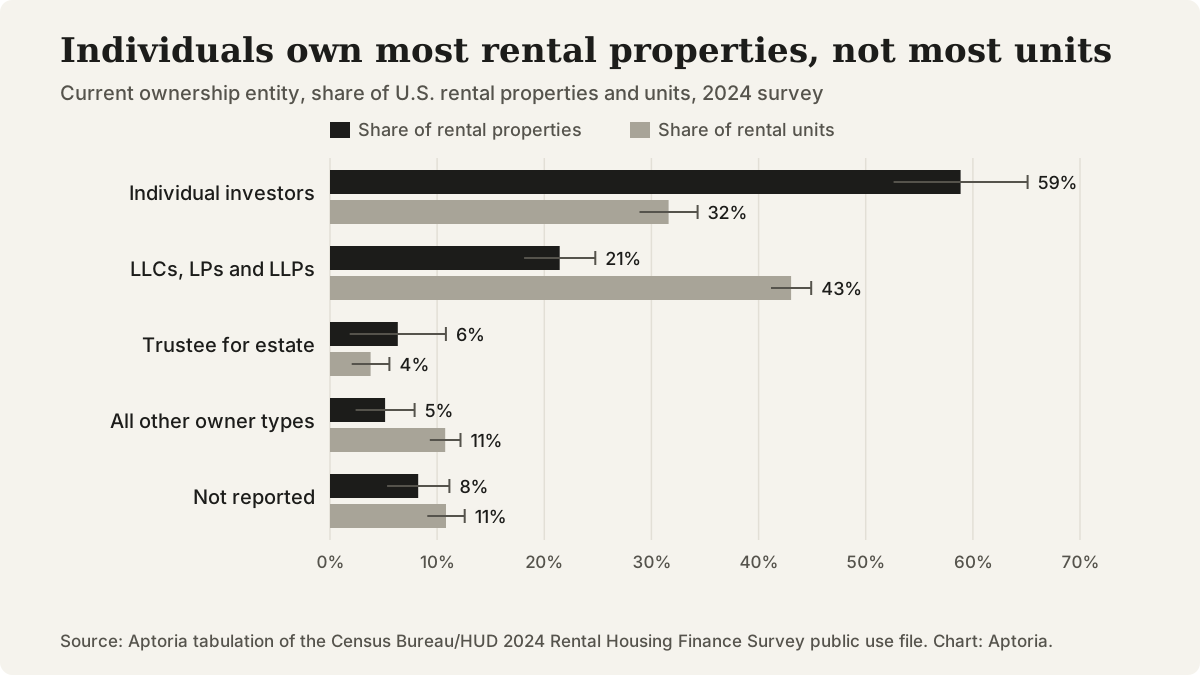
Share of U.S. rental properties and units by ownership entity, 2024. Source: Aptoria tabulation of the Census Bureau/HUD Rental Housing Finance Survey public use file.
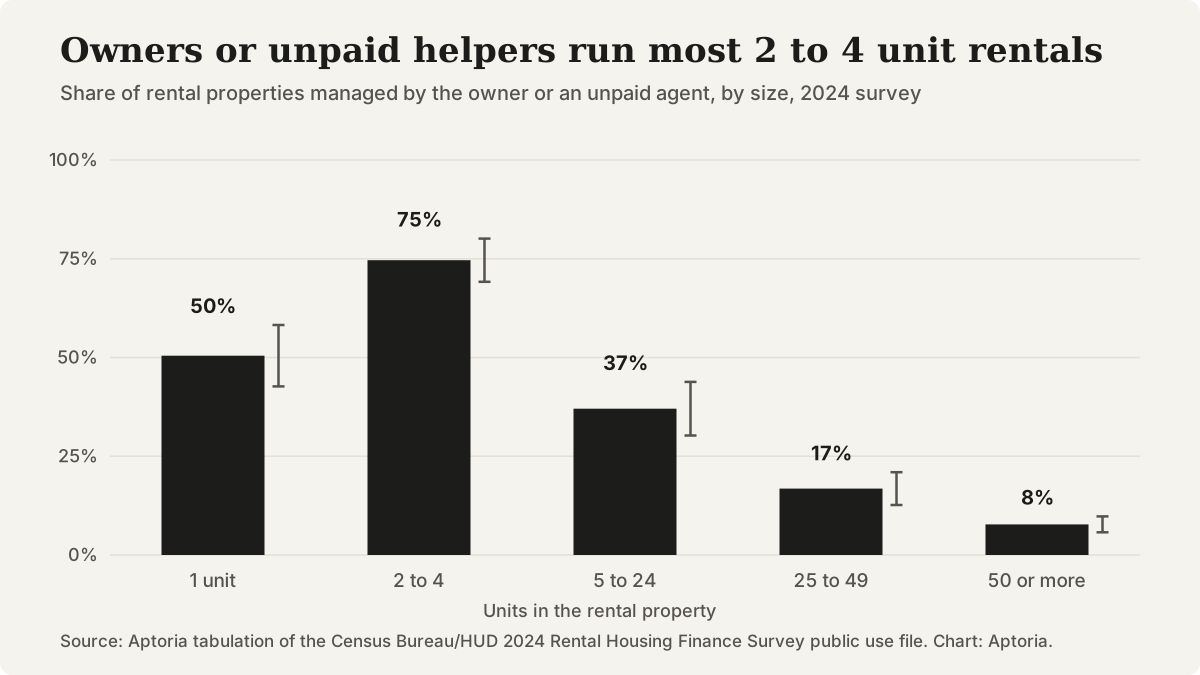
Share of rental properties managed day to day by the owner or an unpaid agent, by property size, 2024. Source: Aptoria tabulation of the Census Bureau/HUD Rental Housing Finance Survey public use file.
Questions that come up
Can this survey tell me how many landlords there are?
No. It samples rental buildings and asks about the property's owner, so it estimates properties and units. Someone who owns five houses shows up as five properties. It does not publish a count of distinct owners.
Does a one-unit rental property mean a single-family house?
Usually, but not always. Census reports that some units whose residents described their building as having two or more units turned out to be single-unit properties, because the rental was a condominium or a townhome owned on its own.
Does this page say whether to hold a rental in an LLC?
No. It reports how owners described their ownership. Liability, tax and lending effects depend on your state and circumstances, so ask an attorney or tax professional about your situation.
How often is this survey repeated?
Census says it reselects the survey's sample about every three years. The 2024 edition's data were released in February 2026, and its financial questions cover calendar year 2023.
Sources and references
Follow each source to check the underlying claim. Access checks and professional review are different steps.