The short answer
Some are, from a low base. At FDIC-insured banks, 1.10% of multifamily loan balances were 90 or more days late or in nonaccrual in Q2 2026, up from 0.11% at the end of 2019 and, by a small margin, the highest since 2013, though far below the 4.71% peak in 2010. Fannie Mae and Freddie Mac report rates below 1%.
Key takeaways
The key numbers
Each lender group measures delinquency differently, so compare each figure with its own history rather than with the others.
| Measure | Latest | A year earlier | As of | Source |
|---|---|---|---|---|
| Bank multifamily loans 90+ days late or nonaccrual (noncurrent) | 1.10% | 1.04% | Q2 2026 | FDIC |
| Bank multifamily loans 30–89 days late | 0.31% | 0.24% | Q2 2026 | FDIC |
| Bank multifamily net charge-offs (annualized) | 0.20% | 0.16% | Q2 2026 | FDIC |
| Bank commercial real estate loans 30+ days late or nonaccrual (includes multifamily; seasonally adjusted) | 1.53% | 1.57% | Q2 2026 | Federal Reserve |
| Freddie Mac multifamily loans two or more monthly payments past due or in foreclosure | 0.64% | 0.48% | August 2026 | Freddie Mac |
| Fannie Mae multifamily loans 60+ days late (seriously delinquent; may be preliminary) | 0.57% | 0.68% | August 2026 | Fannie Mae |
How many bank apartment loans are in trouble?
About $7.3 billion of the $667.6 billion in multifamily loans held by FDIC-insured banks was noncurrent in Q2 2026, meaning 90 or more days past due or in nonaccrual status. That is 1.10% of balances, up from 1.04% a year earlier and 1.07% the quarter before.
The path has not been a straight line. The rate rose from 0.11% at the end of 2019 to 0.30% in Q3 2021, fell to 0.15% in Q3 2022, then climbed sharply through 2024. For the last six quarters it has stayed between 1.04% and 1.10%.
The latest reading is about the same as Q3 2025 (1.09%) and the highest since Q2 2013, when it was 1.14%. It remains well below the 4.71% peak in Q3 2010.
Earlier-stage late payments eased from the first quarter: 0.31% of balances were 30 to 89 days past due, down from 0.40% in Q1 2026 but above 0.24% a year earlier.
Losses written off are still small relative to balances but rose last quarter. Net charge-offs ran at an annualized 0.20% of average multifamily loans, nearly double the 0.12% of the first quarter. That is about level with Q4 2024 (0.20%) and otherwise the highest since Q4 2012. A year earlier the rate was 0.16%; around 2019 it was close to zero, with recoveries exceeding charge-offs in some quarters.
For comparison, loans on nonfarm nonresidential property such as offices and stores had a noncurrent rate of 1.23%, down from 1.38% a year earlier.
What about Fannie Mae and Freddie Mac loans?
The two agencies publish their own monthly rates for the multifamily loans they hold or guarantee. Freddie Mac says its multifamily delinquency rate rose to 0.64% in August 2026, from 0.60% in July and 0.48% a year earlier.
Fannie Mae reports its multifamily serious delinquency rate fell to 0.57% in August, from 0.62% in July and 0.68% a year earlier. Its monthly figures can be preliminary and revised.
So the two agency books moved in opposite directions over the past year. Each company sets its own definition and weights its rate by unpaid loan balance, so, in our reading, a handful of large loans can shift it.
What does the Federal Reserve's commercial real estate measure show?
The Federal Reserve's charge-off and delinquency release does not show multifamily loans separately. Its commercial real estate category, which includes multifamily, construction and nonfarm nonresidential loans, had a seasonally adjusted delinquency rate of 1.53% in the second quarter of 2026, down from 1.57% a year earlier and up from 0.67% at the end of 2019.
The Fed counts loans 30 or more days late as well as nonaccrual loans, a broader definition than the FDIC's noncurrent measure. Commercial real estate charge-offs ran at an annualized 0.14%, compared with 0.18% a year earlier.
Why do the numbers differ?
They cover different loans and use different cutoffs. Banks hold many loans on their own balance sheets; the agencies' books are the loans they own or guarantee; and this page does not cover loans packaged into commercial mortgage-backed securities, because we did not find a free primary source with comparable figures.
The cutoffs also vary: 30 to 89 days, 60 days or more, and 90 days or more or nonaccrual. A loan can count as delinquent in one measure and not yet in another.
| Source | Loans covered | What counts as delinquent | How often |
|---|---|---|---|
| FDIC Quarterly Banking Profile | Bank loans secured by buildings with 5 or more homes, at FDIC-insured institutions | Noncurrent means 90+ days late or no longer accruing interest; 30–89 days late is shown separately | Quarterly, about 55 days after quarter end |
| Federal Reserve Board | Commercial real estate loans at insured U.S.-chartered commercial banks (multifamily is not shown separately in this release) | 30+ days past due and still accruing, or in nonaccrual status | Quarterly |
| Freddie Mac | Multifamily loans in Freddie Mac's book | Two or more missed monthly payments, or in foreclosure; weighted by loan balance | Monthly |
| Fannie Mae | Multifamily loans Fannie Mae owns or guarantees | 60+ days past due, by unpaid balance | Monthly |
What this means for landlords
These are considerations to weigh against your own loan terms and building, not financial or legal advice.
- National delinquency rates say little about any one building. Your rent roll, expenses and loan terms matter far more than the average.
- If a loan on a 5+ unit building matures or its rate resets in the next year or two, the rate available at that time can matter more than these averages. The interest-rates explainer shows how a higher rate changes debt service and DSCR.
- Some loans carry covenants, such as a minimum debt service coverage ratio. If yours does, knowing when and how it is tested can help you spot a problem early.
- Lenders' own policies differ. If a refinance or extension is coming, asking your lender early what it will require is one way to avoid surprises.
- Rising bank noncurrent rates describe the market as a whole; they are not a measure of how your lender will treat your loan.
Methodology
We pull the FDIC's Quarterly Banking Profile time-series spreadsheet, the Federal Reserve's seasonally adjusted charge-off and delinquency tables, and Freddie Mac's and Fannie Mae's monthly summaries with a script, and compute every figure from those files. The agency PDFs are converted to text with the poppler pdftotext tool.
FDIC rates are all FDIC-insured institutions. The noncurrent rate is 90+ day past-due plus nonaccrual balances divided by total outstanding, which the script checks against the FDIC's own rate. The net charge-off rate is annualized, as the FDIC states, and equals four times quarterly net charge-offs divided by average balances. Figures are rounded once, at display.
Limitations
Keep these limits in mind.
- The measures cover different loans and use different definitions; they should not be added together or ranked against each other.
- Loans in commercial mortgage-backed securities are not covered, because we did not find a free primary source with comparable figures.
- The FDIC figures are national totals and do not break out loans by building size, location or interest-rate type.
- Fannie Mae's monthly rates can be preliminary and revised. Freddie Mac excludes loans in forbearance if the borrower is meeting the forbearance terms.
- Agency rates are weighted by unpaid balance; our inference is that a few large loans can move them noticeably.
- September 2026 monthly summaries from Freddie Mac and Fannie Mae had not been published as of October 24, 2026, so August is the latest month shown.
- This page does not forecast delinquency or defaults.
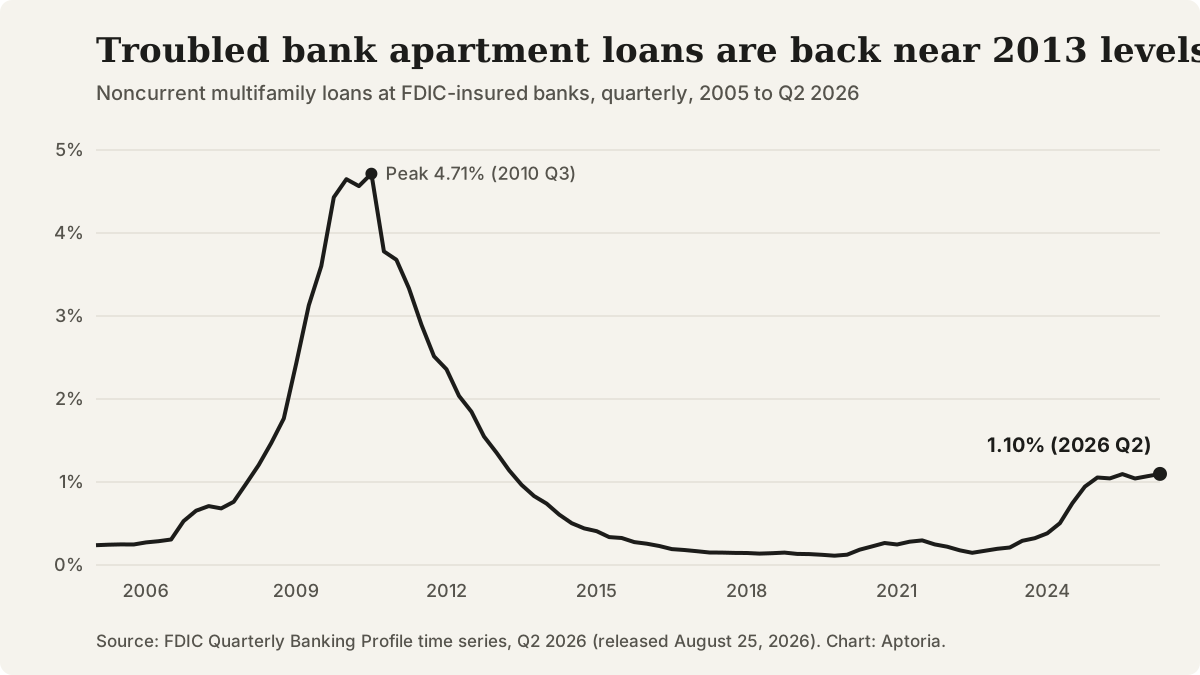
Share of multifamily loans at FDIC-insured banks that are 90+ days late or in nonaccrual, quarterly, 2005 to Q2 2026. Source: FDIC Quarterly Banking Profile.
Questions that come up
What does a noncurrent loan mean?
In the FDIC's figures, a loan is noncurrent once it is at least 90 days late or the bank has stopped booking interest on it. That is a later stage of trouble than a payment 30 days late.
Do these figures include small apartment buildings?
The FDIC's multifamily category follows the Call Report, where banks report loans secured by properties with 5 or more units; loans on 2 to 4 unit buildings are reported with 1-4 family residential loans. Fannie Mae and Freddie Mac use their own definitions. None of the figures are split by building size.
When are these figures updated?
The FDIC publishes about 55 days after each quarter ends, so third-quarter 2026 figures are expected in late November. The Federal Reserve updates its tables quarterly, and Fannie Mae and Freddie Mac publish monthly.
Does this page predict defaults?
No. It reports what each publisher measured and explains how the measures differ.
Sources and references
Follow each source to check the underlying claim. Access checks and professional review are different steps.