The short answer
Mortgage delinquencies are up from unusually low levels but remain far below the 2008–2010 crisis. In Q2 2026, 0.99% of mortgage balances were 90 or more days late, up from 0.82% a year earlier, versus a peak of 8.89% in 2010. About 55,000 people had a new foreclosure on their credit report, below the 2019 quarterly average.
Key takeaways
The key numbers
Three publishers track mortgage distress in different ways, so the table keeps them side by side. The New York Fed measures shares of balances from credit reports, the Federal Reserve measures loans on bank books, and FHFA measures shares of loans in a national mortgage sample.
| Measure | Q2 2026 | A year earlier | Q4 2019 | Source |
|---|---|---|---|---|
| Mortgage balances 90+ days late (share of balances) | 0.99% | 0.82% | 1.07% | NY Fed |
| Balances newly 90+ days late (annualized share of balances) | 1.52% | 1.29% | 1.10% | NY Fed |
| People with a new foreclosure notation (approx.) | 55,000 | 53,000 | 71,000 | NY Fed |
| Bank residential loans 30+ days late or nonaccrual | 1.86% | 1.78% | 2.34% | Federal Reserve |
| Mortgages 90+ days past due (share of loans; preliminary) | 1.0% | 0.8% | 0.9% | FHFA NMDB |
| Mortgages in foreclosure, bankruptcy or deed in lieu (share of loans; preliminary) | 0.2% | 0.1% | 0.3% | FHFA NMDB |
Are mortgage delinquencies rising?
Yes, modestly, from a low base. The New York Fed's share of mortgage balances 90 or more days late was 0.99% in the second quarter of 2026, up from 0.82% a year earlier and close to the 1.07% of late 2019. It was 1.09% in the first quarter of 2026, the highest reading since the second quarter of 2018.
For scale, the same measure reached 8.89% in the first quarter of 2010 and bottomed at 0.37% in the third quarter of 2022. Total mortgage balances were about $13.12 trillion in Q2 2026.
FHFA's loan-level sample shows the same direction: 1.0% of active mortgages were 90 or more days past due in Q2 2026, up from 0.8% a year earlier. FHFA treats its latest two quarters as preliminary and says initial delinquency estimates are generally higher than revised ones. At banks, the Federal Reserve's delinquency rate on residential real estate loans was 1.86%, slightly above a year earlier (1.78%) and below late 2019 (2.34%).
Are more borrowers starting to fall behind?
The flow into delinquency has picked up. The New York Fed reports these flows as annualized shares of balances. The annualized share of mortgage balances that newly became 90 or more days late was 1.52% in Q2 2026, the highest since the fourth quarter of 2015. A year earlier it was 1.29%. The share newly 30 or more days late was 3.95%, the highest since the second quarter of 2015.
Most borrowers stay current. In Q2 2026, 0.84% of current mortgage accounts moved to 30–60 days late within the quarter and 0.23% moved to 90 or more days late, according to the New York Fed.
| Transition | Q2 2026 | A year earlier |
|---|---|---|
| Current to 30–60 days late | 0.84% | 0.69% |
| Current to 90+ days late | 0.23% | 0.17% |
Are foreclosures rising?
Slightly, and they remain below 2019 levels. About 55,000 people had a new foreclosure on their credit report in Q2 2026, up about 4.5% from a year earlier (53,000) and below the 2019 average of about 69,000 a quarter. These counts are estimates scaled up from the New York Fed's 5% sample of credit reports. The peak in this series was 566,000 in the second quarter of 2009.
FHFA's sample put 0.2% of active mortgages in the process of foreclosure, bankruptcy or deed in lieu in Q2 2026, against 0.1% a year earlier (FHFA publishes these shares to one decimal place, so the change is small and preliminary) and a high of 3.5% in 2010. Bank net charge-offs on residential real estate loans were about zero (0.00% of average loans, annualized, as published), compared with 2.80% at their peak in 2009.
Foreclosure rules and timelines vary by state, so national counts may not match what you see locally.
Where and among whom is delinquency rising?
By borrower age, the New York Fed's measure of balances newly 90 or more days late rose the most for borrowers aged 18 to 29, to 1.89% from 1.32% a year earlier. Borrowers 60 and older had the lowest rates. These age figures come from a separate New York Fed table. Its all-borrower figure (1.47%) differs from the 1.52% headline above, and the New York Fed does not explain the difference.
The New York Fed also publishes figures for 11 states. Among them, Nevada had the highest share of mortgage debt 90 or more days late in Q2 2026 (1.94%) and California the lowest (0.56%). State figures can change sharply from year to year: Nevada's rose from 0.73% to 1.94%.
These are borrower and loan statistics, not measures of renters. They describe homeowners' mortgages and say nothing about any individual's ability to pay rent.
| State | Q2 2026 | A year earlier |
|---|---|---|
| Nevada | 1.94% | 0.73% |
| Florida | 1.62% | 1.63% |
| Illinois | 1.58% | 1.06% |
| Texas | 1.43% | 0.80% |
| Pennsylvania | 1.19% | 1.12% |
| New York | 1.11% | 1.35% |
| Arizona | 0.96% | 0.36% |
| New Jersey | 0.90% | 1.62% |
| Ohio | 0.90% | 0.72% |
| Michigan | 0.76% | 0.61% |
| California | 0.56% | 0.50% |
| United States | 0.99% | 0.82% |
Delinquency by borrower age
The table shows the New York Fed's age breakdown for mortgage borrowers. Ages come from credit records. A small number of records have no birth year, so the age groups may not sum exactly to the total.
| Borrower age | Q2 2026 | A year earlier | New foreclosure notations (thousands), Q2 2026 |
|---|---|---|---|
| 18-29 | 1.89% | 1.32% | 2.9 |
| 30-39 | 1.65% | 1.50% | 10.5 |
| 40-49 | 1.57% | 1.42% | 14.9 |
| 50-59 | 1.75% | 1.44% | 11.5 |
| 60-69 | 0.92% | 0.78% | 7.6 |
| 70 and older | 0.83% | 0.92% | 7.7 |
| All borrowers | 1.47% | 1.29% | — |
Why do the measures disagree?
They count different things. The New York Fed reports shares of mortgage balances, so larger loans count for more. FHFA reports shares of loans, counting each mortgage once. The Federal Reserve counts only loans held by commercial banks, and its delinquency rate includes loans 30 or more days past due as well as loans in nonaccrual status, a wider definition than the 90-day measures.
Sources differ too. The New York Fed and FHFA figures come from credit-report data, while the Federal Reserve's come from bank regulatory reports. Figures can be revised: the New York Fed's August 2026 report, for example, revised first-quarter 2026 credit card balances.
What this means for landlords
These are considerations to weigh against your own loans and local market, not recommendations.
- If you have a mortgage, national delinquency rates do not change your loan terms. If your loan has an escrow account, the annual escrow statement is a natural point to check whether your payment is changing.
- If you are looking for distressed properties, national data show new foreclosure notations still below their 2019 average. That says little about a particular county, where timelines and inventory depend on state rules and local conditions.
- Rising delinquency in some borrower groups is a signal about household finances in general. It is not information about any applicant or tenant, and it should not be used to judge one. Apply consistent written criteria to every applicant and follow applicable law.
- If a property you are buying has a seller in distress, the timeline and process can differ from a standard sale. Rules vary by state, so confirm the process with a professional in that state.
Methodology
We pull the New York Fed's underlying data workbook (August 2026 report), the Federal Reserve's charge-off and delinquency tables (seasonally adjusted, all banks; last updated August 25, 2026) and FHFA's National Mortgage Database performance file with a script, and compute every comparison from those files.
"A year earlier" compares the same quarter of the previous year. "Highest since" means the most recent earlier quarter with an equal or higher value. New York Fed age figures are four-quarter moving sums, as published. FHFA shares use the All Mortgages series for the United States.
We plan to refresh this page after each New York Fed quarterly report and Federal Reserve update.
Limitations
Keep these limits in mind.
- National figures hide large differences between states, counties and loan types.
- Shares of balances, shares of loans and bank-only rates are not interchangeable.
- Foreclosure figures from the New York Fed count people with a new foreclosure on their credit report; they are not a count of properties sold.
- State figures are published for only 11 states.
- Figures are revised. FHFA's latest two quarters are preliminary. Third-quarter 2026 data will come in the New York Fed's next report; its date was not confirmed when this page was updated.
- This page does not forecast delinquency or foreclosures.
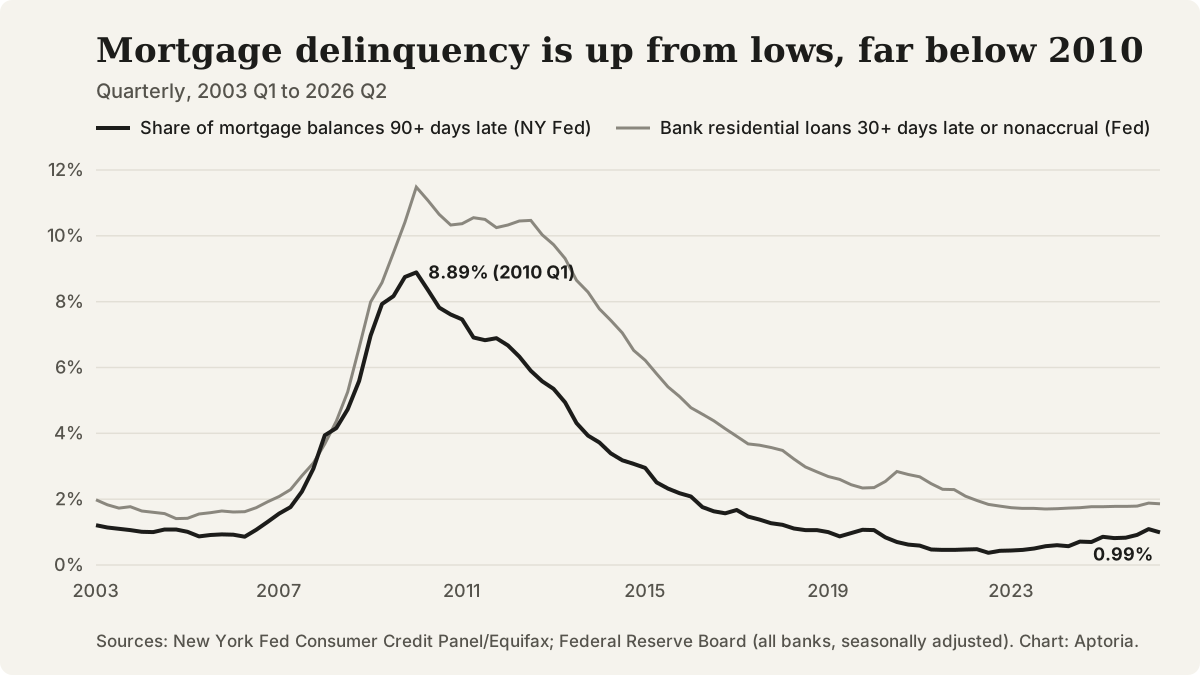
Share of mortgage balances 90+ days late (New York Fed) and bank residential delinquency rate (Federal Reserve), quarterly, 2003 to Q2 2026.
Questions that come up
What does 90 days delinquent mean?
The borrower is at least 90 days behind on scheduled payments. The New York Fed calls this serious delinquency. FHFA reports loans 90 or more days past due separately from loans already in foreclosure.
Why is the Federal Reserve's rate higher than the others?
Partly because it counts loans 30 or more days past due plus loans in nonaccrual status, while the headline New York Fed and FHFA figures are for 90 or more days late. It also covers only loans held by commercial banks, and the Fed's residential category includes home equity lines of credit.
Does this data tell me anything about my tenants?
No. It describes homeowners' mortgages in aggregate. It does not measure renters and should not be used to judge any person's application.
How often is this updated?
The New York Fed and the Federal Reserve publish quarterly, and FHFA updates its mortgage database quarterly. We plan to refresh this page after each release.
Sources and references
Follow each source to check the underlying claim. Access checks and professional review are different steps.