The short answer
Yes, but more slowly. State and local governments collected $846.0 billion in property taxes over the four quarters ending in the second quarter of 2026, 2.2% more than a year earlier, according to the Census Bureau. That is down from 7.8% growth the year before, and slightly below inflation of about 3.1%. Over ten years, collections rose 59.7%.
Key takeaways
The key numbers
These figures come from the Census Bureau's Quarterly Summary of State and Local Government Tax Revenue, last updated September 10, 2026, which covers collections through the second quarter of 2026.
| Measure | Value | Change |
|---|---|---|
| Collections over the last four quarters | $846.0 billion | +2.2% vs a year earlier |
| Collections in Q2 2026, seasonally adjusted | $212.3 billion | +4.0% vs Q2 2025 |
| Four-quarter collections, ten years earlier | $529.8 billion | +59.7% over ten years (4.8% a year) |
| Ten-year change after inflation | +16.1% | Adjusted with CPI-U |
| Share collected by local governments | 96.9% | States collect 3.1% |
| Property tax share of the four major taxes Census tracks quarterly for state and local governments combined | 37.2% | Last four quarters |
Are property taxes still rising?
Nationally, yes, based on preliminary figures for the latest quarter. Total property tax collections were 2.2% higher over the four quarters ending in the second quarter of 2026 than a year earlier. On a seasonally adjusted basis, collections in that single quarter were 4.0% above the second quarter of 2025.
Growth has cooled from a fast stretch. The four-quarter total grew 7.8% over the four quarters ending in the second quarter of 2025, and growth reached 10.3% in Q4 2024, the fastest since Q3 2009. From 2010 through 2019 the quarterly year-over-year growth rate averaged 2.8%.
After inflation, the latest year was roughly flat. Consumer prices rose about 3.1% over the same 12 months, so collections fell 0.8% in real terms. Over ten years they rose 59.7% before inflation and 16.1% after it.
| Four quarters ending | Change from a year earlier |
|---|---|
| Q2 2019 | +4.3% |
| Q2 2020 | +3.4% |
| Q2 2021 | +6.7% |
| Q2 2022 | +1.5% |
| Q2 2023 | +7.7% |
| Q2 2024 | +6.0% |
| Q2 2025 | +7.8% |
| Q2 2026 | +2.2% |
Does this mean my tax bill is going up?
Not necessarily. These figures are total collections by state and local governments, not a measure of any single property's bill.
Your bill depends on your property's assessed value and the rates set by the governments that tax it, and both vary from place to place.
Who collects property taxes?
Mostly local governments. Over the last four quarters, state governments collected 3.1% of U.S. property taxes, leaving about 96.9% to local governments.
Property tax is the largest of the four major tax categories Census tracks quarterly for state and local governments combined (property, individual income, corporate income and general sales): 37.2% of their total over the same four quarters, ahead of individual income taxes ($620.6 billion) and general sales taxes ($618.6 billion).
How does this compare with home values?
Home values rose faster. FHFA's purchase-only house price index was 95.1% higher in June 2026 than ten years earlier, while four-quarter property tax collections rose 59.7% over the same span. Over the latest year, home values rose 2.3% and collections 2.2%.
The two measures are not directly linked. An index of home sale prices is not the same as assessed values, and assessment cycles and rate decisions differ by jurisdiction. This data cannot show how values feed into any particular place's tax bills.
What this means for landlords
These are considerations for your own properties, not tax or legal advice. Assessment, rate and appeal rules vary by jurisdiction.
- Budget for tax growth even when it slows. Four-quarter collections have been higher than a year earlier in every quarter since Q3 2012.
- Read your assessment notice when it arrives and check the property details it lists. Some places assess at a fraction of market value, so learn how your locality sets assessments before comparing them with sale prices. Deadlines and procedures to question an assessment vary by state and locality.
- If your lender collects taxes through an escrow account, a change in your tax bill changes your escrow payment and your total monthly payment, as the CFPB explains. Without escrow, set the money aside yourself.
- Include taxes in your renewal and cash-flow math. A rent that covered costs two years ago may not today, subject to any state or local limits on rent increases.
- When comparing properties to buy, ask the local assessor how a sale could affect the next assessment, since the seller's current bill may not carry over in every jurisdiction.
What changed in this update
First published October 23, 2026, with Census data through Q2 2026. Future updates will note what moved.
Methodology
We pull the Census Bureau's full QTAX time series and its latest release tables with a script and compute every figure from those files.
The main measure is property tax collections over the four quarters ending in each quarter, which smooths out the large seasonal swings in when taxes are paid. Inflation-adjusted changes divide that growth by the change in average CPI-U over the same 12 months. Because BLS did not publish October 2025 CPI, every window leaves out October so the comparisons match. The state share is the state-government series divided by the state and local total; Census's state series excludes D.C., so the 96.9% / 3.1% split is approximate.
We plan to refresh this page after each quarterly Census release.
Limitations
Keep these limits in mind.
- Local property taxes come from a Census sample, so the national figure has sampling error. Census puts the coefficient of variation for the Q2 2026 quarterly property tax estimate at 1.96%. Missing local data are imputed, and Census says figures are subject to revision for up to seven prior quarters. Q2 2026 is preliminary; its property tax response rate was 81.3%, compared with 89.5% a year earlier.
- These are national totals. They say nothing about the bill on a specific property or in a specific town.
- Collections are nominal dollars unless we say they are adjusted for inflation.
- The CPI series used for inflation has no October 2025 value because of the 2025 federal funding lapse, so every inflation comparison leaves out October.
- This page does not forecast tax rates or assessments.
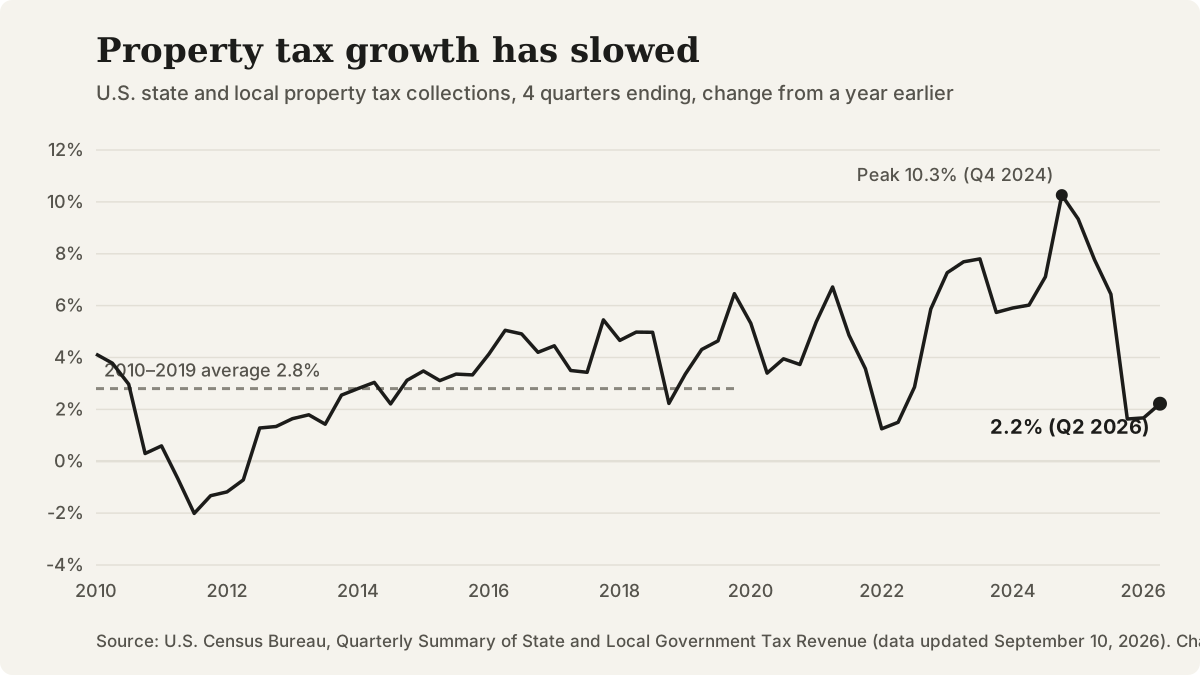
Year-over-year change in U.S. state and local property tax collections, four quarters ending, Q1 2010 to Q2 2026. Source: U.S. Census Bureau, QTAX.
Questions that come up
How often does the Census Bureau publish this data?
Quarterly. The dataset used here was last updated September 10, 2026 and runs through Q2 2026. Census can revise figures for up to seven prior quarters as governments send revisions or replace estimated data.
Why do quarterly property tax numbers jump around so much?
Collections are highly seasonal. Unadjusted collections were $342.6 billion in the fourth quarter of 2025 but $148.2 billion in the second quarter of 2025. That is why this page leads with four-quarter totals and seasonally adjusted figures.
What counts as property tax in this data?
The Census Bureau's property tax category (code T01) as reported by state and local governments in its quarterly survey. It is a national total, not a measure of any one tax bill.
Does this page predict next year's property taxes?
No. It reports published data. Your local assessor and taxing jurisdictions set assessments and rates.
Sources and references
Follow each source to check the underlying claim. Access checks and professional review are different steps.