The short answer
About 677,000 apartment units were under construction in buildings with five or more units in September 2026 (preliminary, seasonally adjusted), 32.4% below the record of about 1,001,000 in July 2023. The 3.1% drop from a year earlier is within Census's margin of error. Multifamily buildings took 16.5 months on average to finish in 2025.
Key takeaways
The pipeline in six numbers
These figures come from the Census Bureau's New Residential Construction release of October 20, 2026, plus its historical series. The pipeline ratio is our own calculation, explained below.
| Measure | Latest | Comparison | As of |
|---|---|---|---|
| Units under construction, buildings with 5+ units | 677,000 | 699,000 a year earlier (−3.1%, not statistically significant) | September 2026 (preliminary, seasonally adjusted) |
| Highest on record (monthly data begin in 1970) | 1,001,000 | Today is 32.4% lower | July 2023 |
| Authorized but not yet started, 5+ units | 123,000 | 108,000 a year earlier (+13.9%, statistically significant) | September 2026 |
| Units completed in the past 12 months, 5+ units | 409,000 | 511,000 in the prior 12 months (−19.9%) | 12 months to September 2026 |
| Pipeline at the recent completion pace (our ratio) | 19.9 months | 16.4 months a year earlier | September 2026 |
| Average time from start to completion, buildings with 2+ units | 16.5 months | 17.1 in 2022 and 2023; 15.4 in 2019 | 2025 |
How many apartments are under construction?
About 677,000 units in buildings with five or more units were under construction in September 2026, seasonally adjusted. That is down from 699,000 a year earlier, a 3.1% drop. Census's 90% confidence interval for that change is ±4.3 points, so it cannot say whether the count actually fell.
The bigger change is from the peak. The count reached about 1,001,000 in July 2023, the highest in Census data back to 1970, and is now 32.4% lower. Before the peak, it was last this low in July 2021. It is still 10.9% above its 2019 average of about 610,000.
The lowest reading since the peak so far was about 647,000 in May 2026, and the latest figure is about 30,000 higher. Census publishes no confidence interval for a change over several months like that one (its interval for a single month's change in this series is about ±1.4 points), and recent months are preliminary, so the data cannot yet say the decline has ended. Census also cautions that single-month moves in its seasonally adjusted figures can be erratic. Counting all housing, including single-family homes, units under construction fell 3.3% over the year, a change Census does count as statistically significant.
Is the pipeline still shrinking, or starting to refill?
The next stage back is permits that have not broken ground. Units authorized but not yet started in buildings with five or more units rose to about 123,000 in September 2026, up 13.9% from a year earlier. Census's confidence interval is ±13.1 points, so the rise is statistically significant, but only just. A larger backlog can mean more projects are lined up, or that permitted projects are taking longer to break ground. It is still 23.1% below its February 2023 high, the highest since that series began in 1999. Census counts this backlog only in places that require a building permit.
Census's own start figures point both ways. Starts in buildings with five or more units were up 6.9% in the first nine months of 2026 compared with 2025, a change Census does not count as statistically significant (±10.9 points). September's seasonally adjusted rate was 25.9% below a year earlier, which is significant (±21.5).
Completions are falling faster than the pipeline. About 409,000 units in buildings with five or more units were finished in the 12 months to September 2026, 19.9% fewer than in the 12 months before. Census publishes no margin of error for that 12-month sum, but its own year-to-date comparison shows completions in these buildings down 16.3% (±11.1), a statistically significant decline. Our housing market page tracks monthly completions in more detail.
Dividing units under construction by the past year's completions gives a rough sense of how long the current pipeline would take to clear at the recent pace: about 19.9 months now, against 16.4 months a year earlier and 29.3 months at the July 2023 peak. This is our ratio, not a Census statistic, and the pace of completions changes from month to month.
How long does it take to build an apartment building?
About 16 to 17 months on average. In 2025, buildings with two or more units took 16.5 months on average from the start of construction to completion, and buildings with 20 or more units took 19.1 months. A single-family home took 7.4 months.
Build times have stretched over the past decade. The multifamily average was 12.2 months in 2015 and 15.4 months in 2019, then reached 17.1 months in both 2022 and 2023. The 2025 figure is a little lower, but Census's table lists a relative standard error of 5% in an unlabeled row beneath the latest year. If that applies to 2025, the 90% range is roughly ±1.4 months. Small year-to-year differences are within that range.
Before construction starts, there is also a wait after the permit is issued. For buildings with two or more units, that averaged 2.4 months in 2025, compared with 2.8 months in 2022 and 2023 and 1.9 months in 2019.
| Building | 2015 | 2019 | 2022 | 2023 | 2024 | 2025 |
|---|---|---|---|---|---|---|
| 2+ units (all multifamily) | 12.2 | 15.4 | 17.1 | 17.1 | 16.9 | 16.5 |
| 20+ units | 14.3 | 17.2 | 18.1 | 18.9 | 19.4 | 19.1 |
Where are the apartments being built?
The South holds the largest share of the multifamily pipeline, about 39.5% of units under construction in buildings with two or more units, followed by the West at 26.6%. Census does not publish regional figures for buildings with five or more units, so these regional numbers are our calculation: all units under construction minus single-family homes.
Over the past year the derived count was lower in the Northeast and South. The small increases in the Midwest and West are well within sampling error. Census publishes no confidence intervals for these derived figures, but its own regional totals for all housing under construction show statistically significant declines only in the Northeast (−8.4%, ±7.0) and South (−4.8%, ±4.2). Average build times also differ by region, from 14.2 months in the Midwest to 19.2 months in the West in 2025, each with its own sampling error.
| Region | Units under construction | Share of U.S. | Change from a year earlier | Average months to complete (2025) |
|---|---|---|---|---|
| South | 274,000 | 39.5% | −7.7% | 14.7 (RSE 10%) |
| West | 184,000 | 26.6% | +2.8% | 19.2 (RSE 8%) |
| Northeast | 140,000 | 20.2% | −8.5% | 18.7 (RSE 12%) |
| Midwest | 95,000 | 13.7% | +5.6% | 14.2 (RSE 4%) |
What this means for landlords
These are considerations for an owner of a few units, not predictions.
- As a rough guide, units under construction today would reach the market over about the next year and a half: multifamily buildings averaged 16.5 months from start to completion in 2025, and the pipeline equals about 20 months of recent completions. Individual projects vary widely.
- Nationally, that pipeline is about a third smaller than at its July 2023 peak, and completions over the past year were down 19.9%. Fewer brand-new units competing for tenants is one factor in pricing, alongside local demand and existing vacancy.
- The backlog of permitted, unstarted apartments rose 13.9% over the year, a statistically significant change by a narrow margin. Local permit and start numbers say more about your area than the national figure.
- A large building opening near your property may matter more to you than the national totals. Local permit records or your planning office can show what has been approved nearby.
- Our rental vacancy by metro page and housing market page show how current conditions compare in different places.
What changed in this update
First published October 24, 2026, with Census data released October 20, 2026.
Methodology
We pull the Census Bureau's New Residential Construction time series, the September 2026 release tables and text, the build-time tables and the Survey of Construction definitions with a script, and compute every figure from those files.
Levels under construction and authorized but not started are seasonally adjusted monthly counts. The 12-month completion totals sum Census's not seasonally adjusted monthly figures. Year-over-year changes and their confidence intervals are Census's own where Census publishes them. The pipeline ratio divides the latest seasonally adjusted count under construction by the past 12 months of completions, times 12.
Build-time margins are approximate: 1.645 times Census's relative standard error times the estimate. Regional multifamily figures subtract single-family units from all units, so they include buildings with two to four units. Census's next release is scheduled for November 18, 2026.
Limitations
Keep these limits in mind.
- The September 2026 figures are preliminary, and Census revises recent months. It notes that it can take six months to establish a trend in completions.
- Under-construction counts are survey estimates with sampling error. Census puts the average relative standard error for the 5+ unit series at about 5% over the latest six months.
- For buildings with two or more units, Census treats the whole building as finished once half or more of its units are lived in or ready to move into, so completion dates are approximate.
- The pipeline ratio, the 12-month completion totals and the regional multifamily figures are our calculations and have no published margins of error.
- The build-time table does not say which year its relative standard error row covers; we treat it as the latest year.
- National figures do not tell you what is being built near your property.
- This page does not forecast construction or rents.
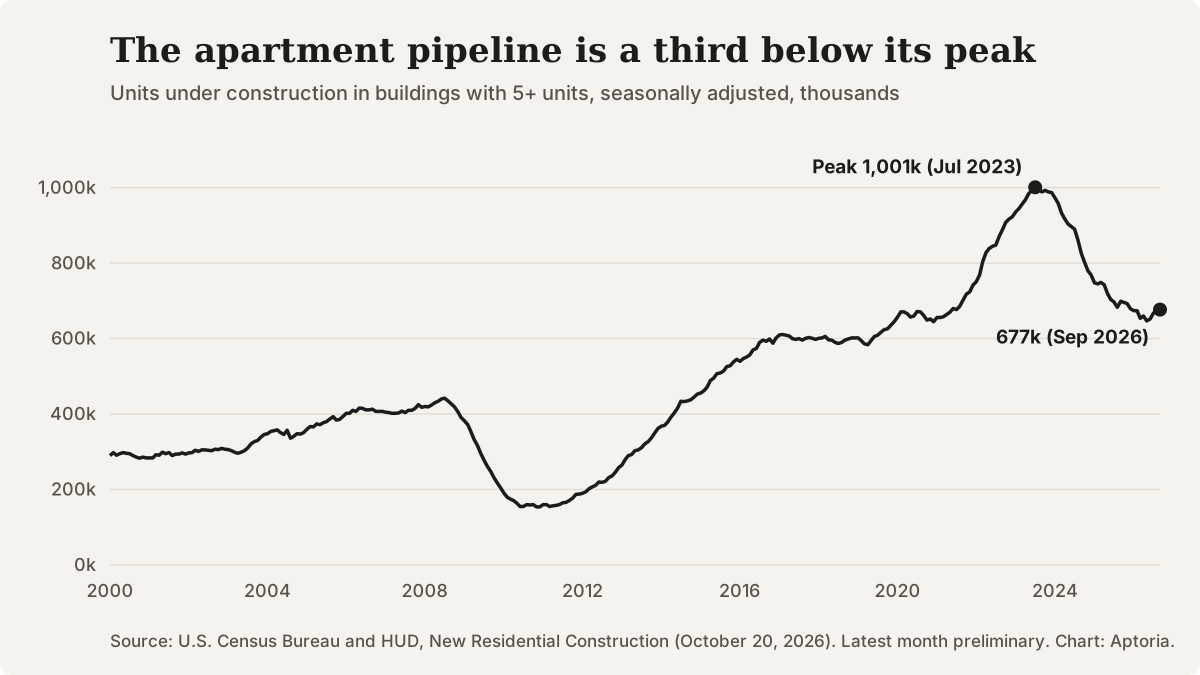
Units under construction in buildings with five or more units, seasonally adjusted, January 2000 to September 2026. Source: U.S. Census Bureau and HUD, New Residential Construction.
Questions that come up
What counts as under construction?
Census counts homes where building has begun but is not finished. In Census's terms, building begins when crews start digging for the foundation, and in a multifamily building every unit is treated as started on that day.
Why does the page focus on buildings with five or more units?
That is the closest Census category to apartment buildings in its monthly national tables. Buildings with two to four units are a small group: about 16,000 units under construction in September 2026, roughly 1.3% of all units, in Census's not seasonally adjusted figures. Census's footnote says the adjusted series for them fails its tests for stable seasonality, so it is not published.
Does this include single-family homes built to rent?
No. Single-family homes are counted separately. Our build-to-rent page covers single-family homes built for rent.
When does Census publish new figures?
Monthly. The next New Residential Construction release is scheduled for November 18, 2026. Build-time averages are annual.
Sources and references
Follow each source to check the underlying claim. Access checks and professional review are different steps.