The short answer
Nearly one in ten households that do not own their home had no bank account in 2023. The FDIC's survey found 9.4% of non-homeowner households, about 4.2 million, were unbanked, against 1.6% of homeowners. Another 21.2% of non-homeowners had an account but used a nonbank service such as a money order, check casher or payday loan in the past 12 months.
Key takeaways
The key numbers
The FDIC's survey sorts households into homeowners and non-homeowners. In the FDIC's processing code, non-homeowners are households whose home is rented for cash or occupied without payment of cash rent, the same group Census's Current Population Survey housing tables count as renter occupied. It is the closest federal measure of renter households, not a count of signed leases.
In 2023, 9.4% of non-homeowner households were unbanked, meaning no one in the household had a checking or savings account at a bank or credit union. That is about six times the homeowner rate of 1.6% (our comparison). Non-homeowners are about a third of all households (33.7%) but 75.1% of unbanked households.
| Measure | Non-homeowners | Homeowners | All households |
|---|---|---|---|
| Households (millions) | 45.1 | 88.6 | 133.7 |
| Unbanked: no one in the household has a bank or credit union account | 9.4% | 1.6% | 4.2% |
| Unbanked households (millions) | 4.2 | 1.4 | 5.6 |
| Underbanked: has an account but used a nonbank financial service | 21.2% | 10.6% | 14.2% |
| Fully banked | 69.4% | 87.8% | 81.6% |
| Cash-only unbanked | 6.1% | 1.1% | 2.8% |
| Used a nonbank money order in the past 12 months | 14.5% | 4.7% | 8.0% |
| Used a nonbank check casher in the past 12 months | 4.8% | 1.6% | 2.7% |
| Using a nonbank online payment service | 50.5% | 49.3% | 49.7% |
| Using a prepaid card | 8.0% | 4.8% | 5.9% |
| Mobile banking is the main way of using the account (banked households that used their account in the past 12 months) | 57.2% | 44.2% | 48.3% |
Is the share without a bank account falling?
Over the long run, yes. Nationally, the unbanked rate peaked at 8.2% of households in 2011, the highest since the survey began in 2009, and was 4.2% in 2023, about half the 2011 level. Along the way it was 7.7% in 2013, 7.0% in 2015, 6.5% in 2017 and 5.4% in 2019.
For non-homeowners the rate was 11.8% in 2019 and 9.4% in both 2021 and 2023. The FDIC tests only the 2021 to 2023 change in this table, and that change was not statistically significant for either group.
| Group | 2019 | 2021 | 2023 | 90% confidence interval, 2023 |
|---|---|---|---|---|
| Non-homeowners | 11.8% | 9.4% | 9.4% | 8.8% to 10.0% |
| Homeowners | 1.9% | 1.8% | 1.6% | 1.4% to 1.8% |
| All households | 5.4% | 4.5% | 4.2% | 4.0% to 4.5% |
Why do households go without a bank account?
The most common main reason in 2023 was not having enough money to meet minimum balance requirements, cited by 23.3% of unbanked households. Not trusting banks (15.7%) and high fees (8.9%) were next. These figures cover all unbanked households; the FDIC does not split main reasons by homeownership, though three in four unbanked households do not own their home.
Half of unbanked non-homeowners are not looking for an account: 50.9% said they were not at all interested in having one, while 12.1% were very interested and 17.4% somewhat interested.
| Main reason | Share of unbanked households |
|---|---|
| Not enough money to meet minimum balance requirements | 23.3% |
| Don't trust banks | 15.7% |
| Bank account fees are too high | 8.9% |
| Avoiding a bank gives more privacy | 5.1% |
| Don't have the ID required to open an account | 5.1% |
| Problems with past banking or credit history | 3.4% |
| Bank locations are inconvenient | 2.5% |
| Banks don't offer needed products and services | 1.7% |
| Bank account fees are too unpredictable | 1.2% |
| Some other reason | 18.1% |
| Did not select a reason | 15.0% |
How do unbanked households pay bills?
66.2% of unbanked households were cash only in 2023, meaning they were using neither a nonbank online payment service nor a prepaid card; the FDIC notes these households likely rely on cash and paper payments such as money orders. 26.3% had bought a money order somewhere other than a bank in the past 12 months, and 93.8% of those used money orders to pay bills, a category the survey asks about as "pay bills like rent, mortgage, utilities, or child care".
Payment apps and prepaid cards reach some unbanked households. 21.6% were using a prepaid card and 20.1% a nonbank online payment service; the FDIC gives PayPal, Venmo and Cash App as examples and excludes Zelle, which works through bank accounts. Among unbanked households using them, 60.8% of online payment service users and 73.9% of prepaid card users used them to pay bills.
Among non-homeowners as a whole, 14.5% used a nonbank money order in the past 12 months, down from 17.2% in 2021 and 21.2% in 2019. The share who were cash-only unbanked rose to 6.1% from 5.3% in 2021. Both changes from 2021 were statistically significant.
| Measure | Unbanked households |
|---|---|
| Used a nonbank money order in the past 12 months | 26.3% |
| Used a nonbank check casher in the past 12 months | 18.2% |
| Using a prepaid card | 21.6% |
| Using a nonbank online payment service | 20.1% |
| Cash only: using neither a nonbank online payment service nor a prepaid card | 66.2% |
What this means for landlords
These are considerations to weigh against your own tenants and local rules, not recommendations.
- If rent can only be paid by bank transfer, households without an account need another route. Nationally, 9.4% of non-homeowner households had no account in 2023, and among unbanked households that bought money orders, 93.8% used them to pay bills.
- Rules on accepted rent payment methods vary by state and locality. Check the rules where your property is before changing how you take rent.
- For any payment taken outside a bank, such as a money order or cash, recording it on the day it arrives keeps your ledger current. Receipt rules vary by state and locality.
- Having an account does not mean every payment flows through it: 21.2% of non-homeowners were underbanked, and 57.2% of banked non-homeowners who used their account did so mainly through mobile banking.
- Survey figures describe groups of households, not applicants or tenants. Apply any payment policy the same way to every tenant.
Methodology
The FDIC National Survey of Unbanked and Underbanked Households is a supplement to the Census Bureau's Current Population Survey. The 2023 supplement was conducted in June 2023; 42,083 households took part in the CPS and 29,483 answered the supplement, an overall supplement response rate of 49 percent.
The FDIC defines a household as unbanked if no one in it had a checking or savings account at a bank or credit union, and as underbanked if it had an account but in the past 12 months used at least one of eight nonbank financial services: money orders, check cashing, international remittances, rent-to-own services, or payday, pawn shop, auto title or tax refund anticipation loans. Cash-only unbanked households are unbanked households using neither a nonbank online payment service nor a prepaid card.
Figures by homeownership come from the FDIC's 2023 appendix tables A.2, A.5, B.3, C.1, C.2, C.5, D.1, D.2, D.4, G.1 and G.4; uses of online payment services and prepaid cards from C.3 and C.4; main reasons from table A.7; the national trend from the 2023 report. Household counts in millions and the ratio of non-homeowner to homeowner rates are our calculations from the FDIC's figures. Statements that a change is statistically significant follow the FDIC's tests at the 10 percent level.
In the FDIC's processing code, a household is a homeowner when the Current Population Survey records its home as owned or being bought by a household member, and a non-homeowner when the home is rented for cash or occupied without payment of cash rent.
Limitations
Keep these limits in mind when using the figures.
- Non-homeowners are not exactly renters. The group includes households that live somewhere without paying cash rent, and the FDIC's tables do not separate them.
- The survey measures households, not individuals. A household counts as banked if anyone in it has an account, so some adults in banked households may have no account of their own.
- Main reasons are published for all unbanked households, not by homeownership.
- Estimates come from a sample and carry sampling error; the FDIC publishes 90% confidence intervals for rates, shown above for the unbanked rate. Answers are self-reported.
- The 2023 survey is the latest the FDIC has posted. As of October 25, 2026, its survey page lists no 2025 results. Since 2011 the survey has been run in June of odd-numbered years (the first, in 2009, was in January), and the FDIC says new reports are released in the fall of even-numbered years.
- Household counts come from survey weights, which the FDIC notes run somewhat higher than Census's household estimates (133.7 million vs 130.1 million in June 2023).
- National figures do not show conditions in any one state, city or property.
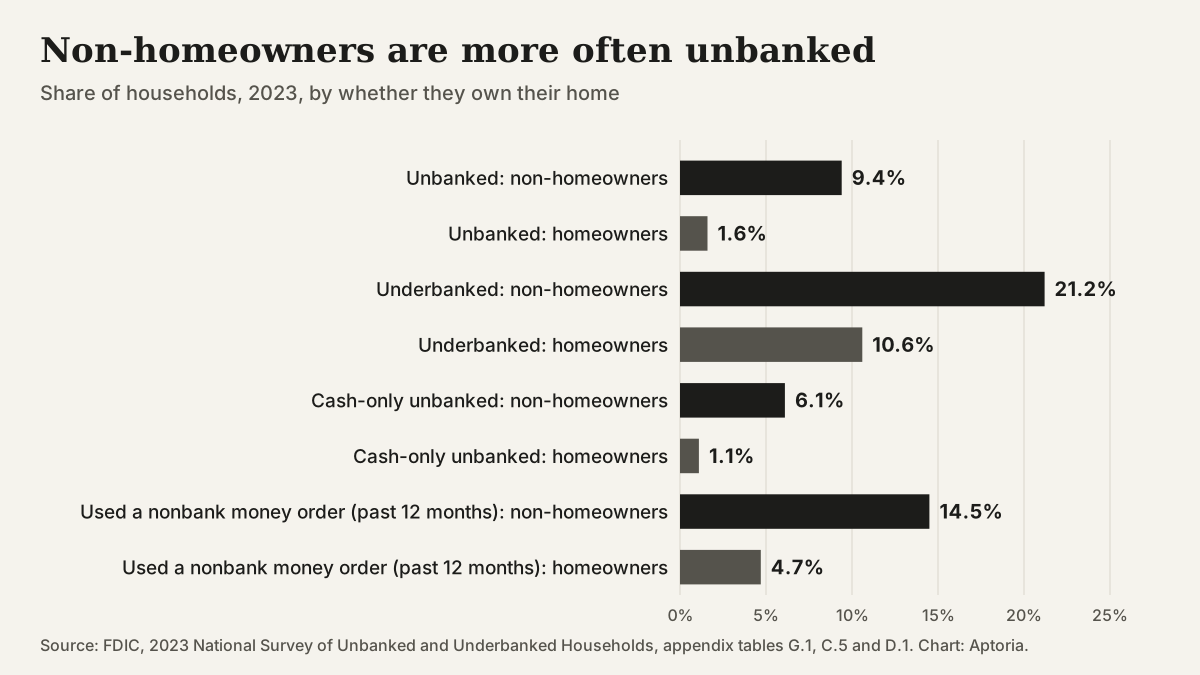
Banking measures by whether households own their home, 2023. Source: FDIC, 2023 National Survey of Unbanked and Underbanked Households, appendix tables G.1, C.5 and D.1.
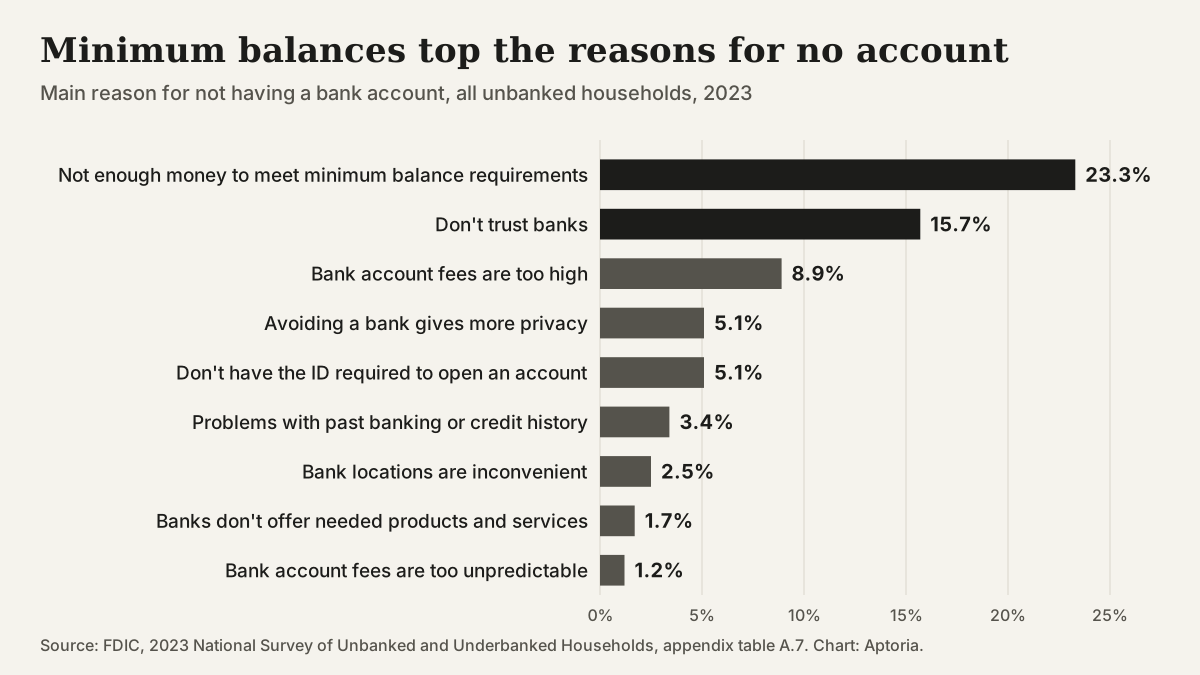
Main reason for not having a bank account, all unbanked households, 2023. Source: FDIC, 2023 National Survey of Unbanked and Underbanked Households, appendix table A.7.
Questions that come up
Does this page count renters exactly?
Close, but not exactly. The FDIC's tables split households into homeowners and non-homeowners. Non-homeowners are households that rent for cash or live in a home without paying cash rent, which matches Census's renter-occupied category. The tables do not separate the two.
What does underbanked mean?
A household with a bank or credit union account that, in the past 12 months, also used a nonbank service such as a money order, check casher, rent-to-own service or payday loan. 21.2% of non-homeowner households and 10.6% of homeowners were underbanked in 2023.
How many households have no bank account in total?
About 5.6 million, or 4.2% of U.S. households, in 2023. About 4.2 million of them did not own their home and about 1.4 million did.
Does this page include 2025 data?
No. As of October 25, 2026, the FDIC's survey page lists the 2023 survey, published in November 2024, as the latest. The FDIC usually releases new results in the fall of even-numbered years.
Sources and references
Follow each source to check the underlying claim. Access checks and professional review are different steps.