The short answer
More renters report falling behind. In the Federal Reserve's October 2025 household survey, 23% of renters said they had been behind on rent at some point in the past year, up from 21% in 2024 and 17% in 2021. Lower-income renters were most affected: nearly one-third of those with family income under $50,000 had fallen behind.
Key takeaways
The key numbers
Survey measures come from different sources and periods; the dates are shown for each. Rows labelled as our tabulation are computed from the Fed's public-use survey files and reproduce the Fed's own published figures where both exist.
| Measure | Latest | Earlier | Source |
|---|---|---|---|
| Renters behind on rent at some point in the past year | 23% (2025) | 21% in 2024; 17% in 2021 | Federal Reserve (SHED) |
| Renters who would cover a $400 expense with cash or its equivalent | 39.9% (2025) | 41.4% in 2024 | Our tabulation of SHED |
| Homeowners who would do the same | 76.0% (2025) | 75.1% in 2024 | Our tabulation of SHED |
| Renters who would not be able to pay a $400 expense by any means | 24.9% (2025) | 25.8% in 2024 | Our tabulation of SHED |
| Median monthly rent, renters who reported one | $1,200 (2025); $1,300 for renters who moved in 2024 or 2025 | Not compared | Federal Reserve (SHED) |
| All adults finding usual expenses somewhat or very difficult to pay | 20.0% (Jul–Aug 2026) | 21.1% in March 2026 | Census (HTOPS, experimental) |
How many renters are behind on rent?
Close to one in four. The Fed's Survey of Household Economics and Decisionmaking asks renters whether they have been behind on rent at any time in the past year. In the survey fielded October 17–28, 2025, 23% said yes.
The share has risen each year since 2022: 17% in 2021, 17% in 2022, 19% in 2023, 21% in 2024 and 23% in 2025. The Fed notes that 2021 was a year when pandemic-era renter protections were in place.
The Fed's report does not publish margins of error. Using the public-use files and the survey weights, our approximate 90% margin on the year-over-year change is about ±1.8 points, and the 2.3-point rise from 2024 to 2025 is larger than that. Treat this as a rough check: it ignores that some people answered in both years.
How does falling behind vary by income?
These are national survey results for groups, not a way to judge any applicant or tenant. Apply the same written criteria to every applicant and follow applicable law, including source-of-income rules where they exist.
The gap by income is wide. In 2025, 33% of renters with family income under $25,000 and 31% of those earning $25,000 to $49,999 reported falling behind, against 5% of renters in the $100,000-and-up group. From 2024 to 2025 the share rose for lower-income renters and held steady for higher-income renters, the Fed reports; every income group is higher than in 2023.
The Fed changed how it asks about income in 2023, so income groups cannot be compared with earlier years.
| Family income | 2023 | 2024 | 2025 |
|---|---|---|---|
| Less than $25,000 | 27 | 31 | 33 |
| $25,000–$49,999 | 26 | 25 | 31 |
| $50,000–$99,999 | 14 | 16 | 17 |
| $100,000 or more | 2 | 6 | 5 |
| Overall | 19 | 21 | 23 |
Can renters cover an unexpected expense?
Fewer than half of renters said they would cover it with cash or its equivalent. The Fed asks how people would pay a hypothetical $400 emergency expense and counts cash, savings or a credit card paid off at the next statement as "cash or its equivalent". By our tabulation of the 2025 public-use file, 39.9% of renters would pay it that way, compared with 76.0% of homeowners.
Some say they could not pay it at all. In the Fed's published figures, 12% of all adults said they would be unable to pay a $400 expense by any means right now. Among renters, our tabulation puts that share at 24.9%, against 4.9% of homeowners.
Among renters who had been behind on rent in the past year, only 12.7% would cover a $400 expense with cash or its equivalent, against 48.0% of renters who had not fallen behind. The margins in the table are our approximation from the survey weights.
| Group | 2024 | 2025 |
|---|---|---|
| All adults (matches the Fed's published figure) | 62.7% (±0.8) | 63.1% (±0.7) |
| Homeowners | 75.1% (±0.9) | 76.0% (±0.8) |
| Renters | 41.4% (±1.6) | 39.9% (±1.5) |
| Renters who had been behind on rent | 12.5% (±2.5) | 12.7% (±2.1) |
| Renters who had not been behind | 48.9% (±1.7) | 48.0% (±1.7) |
What do other measures of household strain show?
They show no sharp change in 2026, and they are not renter-specific. In the Census Bureau's experimental Household Pulse data, 20.0% of adults said paying usual household expenses was somewhat or very difficult in the last two months, asked July 15–August 3, 2026, against 21.1% in March 2026. That change is within our calculated 90% margin. These tables cover all adults; they do not separate renters.
New York Fed credit data put the share of balances that became 90 or more days delinquent at 6.97% for credit cards and 3.00% for auto loans in 2026 Q2, about the same as a year earlier and above their 2019 averages. The New York Fed's report labels these a four-quarter moving sum, and its August 2026 press release describes them as annualized shares of balances moving into delinquency. They describe credit balances, not rent.
| Loan type | 2026 Q2 | A year earlier | 2019 average |
|---|---|---|---|
| Credit cards | 6.97% | 6.93% | 5.17% |
| Auto loans | 3.00% | 2.93% | 2.35% |
What this means for landlords
These are considerations to weigh against your own tenants and lease terms, not recommendations.
- National survey results describe groups. They do not tell you which of your tenants is at risk, and they are not a basis for choosing tenants.
- Early, plain communication when a payment is late can surface a short-term problem before it becomes a larger balance.
- A written payment plan with clear dates can help when a tenant falls behind. Rules on late fees, notices and payment plans vary by state and locality, so check local requirements.
- With fewer than half of renters saying they would cover a $400 expense with cash or its equivalent, it can be worth sizing your operating reserve to absorb at least one missed rent payment.
- The Fed found that 8% of renters had rent payments reported to a national credit bureau in 2025. In our tabulation of the public-use file, about 32% of renters said they did not know. Reporting appears uncommon, so many renters' credit reports may not show their rent history.
Methodology
Published figures (renters behind on rent, income groups, median rent, rent reporting and eviction-related moves) come from the Fed's 2025 report and are checked against its text. The 2025 survey was fielded October 17–28, 2025 with 12,934 respondents; the 2024 survey was fielded October 18–31, 2024 with 12,295.
Our own figures use the Fed's 2024 and 2025 public-use files with the weight the Fed uses in its report. Renters are respondents who said they pay rent; homeowners own with or without a mortgage; the 1,008 respondents in 2025 (905 in 2024) who neither own nor pay rent are left out of renter and owner comparisons. Approximate 90% margins use a design effect computed from the weights, close to the 1.14 the Fed reports for 2025. Our all-adult $400 results, and the share of renters behind on rent, reproduce the Fed's published figures after rounding. The renter and homeowner splits of the $400 question are our own tabulation.
The Household Pulse share combines the "somewhat difficult" and "very difficult" answers to a question about the last two months, among all adults, with margins we calculated from Census's standard-error tables. Census's denominator includes adults who did not answer; excluding them, the shares are 21.3% and 22.7%. Percentages are rounded once, from unrounded values.
Limitations
Read the numbers with these limits in mind.
- Survey answers are self-reported, and "behind at some point in the past year" does not say how far behind or for how long.
- The SHED is an online panel survey with a low cumulative response rate, weighted to match the adult population; the Fed's report does not publish margins of error, so ours are approximations.
- Household Pulse tables are experimental, cover all adults rather than renters, and changed design in March 2026.
- Credit delinquency figures describe borrowers in general, not renters.
- The Fed publishes this survey once a year; the 2025 survey, fielded in October 2025, was published in May 2026, so the latest figures describe late 2025.
- This page does not forecast rent payment trends.
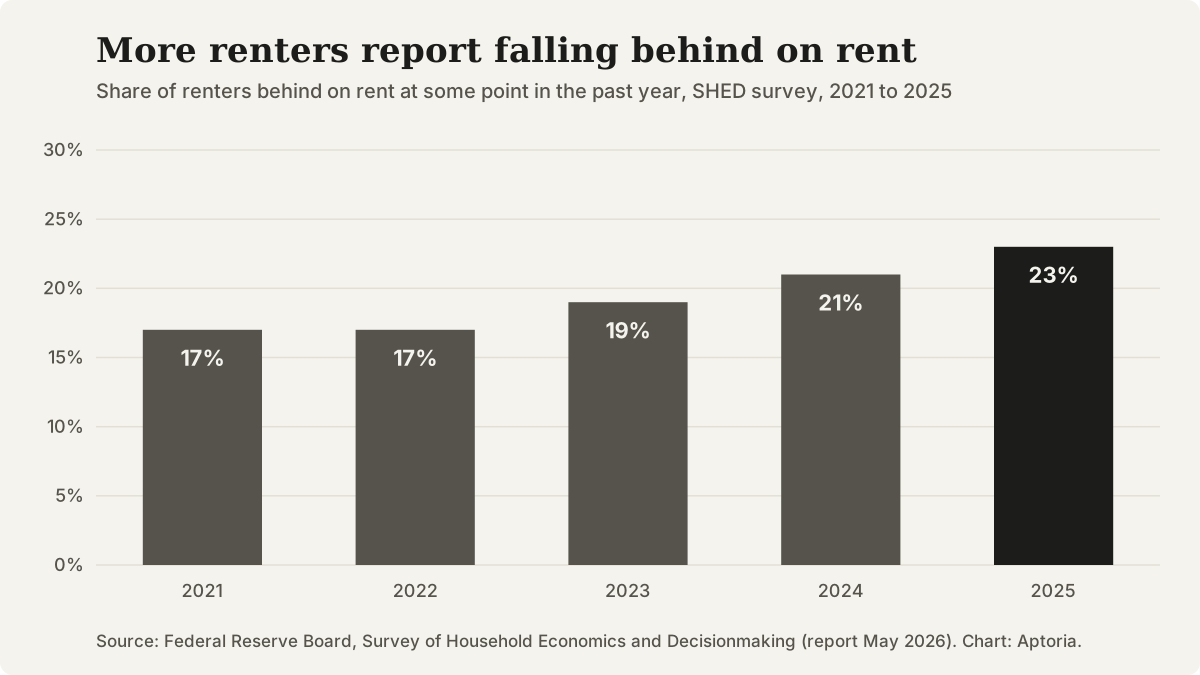
Share of renters behind on rent at some point in the past year, 2021 to 2025. Source: Federal Reserve Board, Survey of Household Economics and Decisionmaking.
Questions that come up
What does 'behind on rent' mean in the Fed survey?
Renters are asked: "Have you been behind on your rent at any time in the past year?" A yes answer counts, regardless of how much was owed or for how long.
Is the increase from 2024 to 2025 meaningful?
The Fed reports a 2-point increase. By our approximate calculation from the public-use files, the change is larger than a 90% margin of about ±1.8 points, but the Fed itself does not publish a significance test for it.
Does this mean more evictions?
Not on its own. In the same survey, 2% of renters said an eviction or threatened eviction was why they moved in the past year, about the same share as a year earlier. This page does not track eviction filings.
How often are these numbers updated?
The Fed's survey runs each fall and is published the following spring. For 2026, Census has posted Household Pulse tables for two collection periods, March and July to August, both on September 24, 2026. The New York Fed reports credit data quarterly.
Sources and references
Follow each source to check the underlying claim. Access checks and professional review are different steps.