The short answer
Most renters cite a financial barrier to buying, but few cite only that. In the Federal Reserve's 2024 household survey, 68% of renters said they could not afford a down payment, yet 58% also said renting is more convenient or flexible and 39% said they prefer it. By our tabulation, 18% of renters cited financial constraints but not convenience, preference, cost or risk.
Key takeaways
The key numbers
The Federal Reserve asks adults who pay rent whether each of eight reasons is a reason they rent rather than own. Renters can say yes to as many as apply, so the shares add to more than 100%. The latest year with this question is 2024.
| Reason | 2022 | 2023 | 2024 |
|---|---|---|---|
| Can't afford down payment | 65% | 65% | 68% |
| More convenient or flexible to rent | 56% | 57% | 58% |
| Can't afford mortgage monthly payment | 44% | 48% | 49% |
| Renting is less financially risky | 42% | 44% | 47% |
| Cheaper to rent | 42% | 42% | 46% |
| Can't qualify for home mortgage | 40% | 40% | 42% |
| Prefer to rent | 36% | 36% | 39% |
| Trying to buy | 32% | 30% | 30% |
What reasons do renters give?
Not being able to afford a down payment was the most common reason in 2024, chosen by 68% of renters. 49% said they could not afford the monthly mortgage payment and 42% said they could not qualify for a mortgage.
Many renters also chose reasons that are not about being shut out of buying. 58% said renting is more convenient or flexible, 47% said it is less financially risky, 46% said it is cheaper, and 39% said they prefer to rent. 30% said they rent because they are trying to buy.
Every reason except trying to buy was chosen by a larger share of renters in 2024 than in 2022; the down-payment share rose from 65% to 68%. The Fed does not publish margins of error for these figures, and some of the year-to-year changes are small enough that they may reflect sampling variation.
How many renters rent only because they cannot buy?
Fewer than one in five. Grouping each renter's answers, our tabulation finds that 74% of renters chose at least one financial constraint, but only 18% chose constraints without any of the four other reasons (cheaper, less financially risky, more convenient or flexible, prefer to rent); about half of that 18% also said they were trying to buy. 55% chose a constraint alongside at least one of those four reasons, and 19% chose one or more of them but no constraint.
Preference and constraint often appear together. 26% of renters said both that they prefer to rent and that a constraint applies, while 13% said they prefer to rent without choosing any constraint. Renters chose 3.8 reasons on average, and 74% chose three or more.
The groups are our own. Cheaper to rent and less financially risky are financial reasons too, but they describe a comparison rather than being unable to buy, so we count them with the other reasons.
| Group | Share of renters | What it includes |
|---|---|---|
| Constraints, not the other four | 18% | Chose at least one of: can't afford down payment, can't afford monthly payment, can't qualify for a mortgage; and none of the other reasons below; may also have chosen trying to buy |
| Constraints and one or more of the four | 55% | Chose at least one constraint and at least one of: cheaper to rent, less financially risky, more convenient or flexible, prefer to rent |
| Any of the four, no constraint | 19% | Chose at least one of those other reasons and no constraint; may also have chosen trying to buy |
| Only trying to buy, or no reason | 7% | Chose only trying to buy, or none of the eight reasons |
How satisfied are renters with where they live?
Less satisfied than owners on each of the four neighborhood measures the Fed reported by tenure for 2024. 63% of renters were somewhat or very satisfied with their neighborhood's overall quality, against 84% of owners. On the cost of housing in their neighborhood, 28% of renters and 43% of owners were satisfied.
These figures describe adults' views of their own neighborhoods. They do not measure the condition of any rental home.
| Characteristic | Owners | Renters |
|---|---|---|
| Overall quality | 84% | 63% |
| Quality of local schools (parents living with their own children under 18) | 69% | 55% |
| Crime risk | 72% | 49% |
| Cost of housing | 43% | 28% |
What this means for landlords
These are considerations to weigh against your own tenants and market, not recommendations.
- Convenience and flexibility were the second most common reason for renting (58%). The survey does not say what renters mean by convenience or flexibility. Lease length options, renewal terms and how quickly requests are handled are parts of a rental an owner controls.
- 30% of renters said they rent because they are trying to buy. Some tenants may move out to buy a home, which is one input into renewal and turnover planning.
- Only 28% of renters were somewhat or very satisfied with the cost of housing in their neighborhood. Comparing your rent with local costs of owning is one way to understand what tenants weigh; see the rent-versus-buy page linked below.
- National survey results describe groups. They do not tell you why any particular tenant rents or plans to move, and they are not a basis for choosing tenants. Apply the same written criteria to every applicant and follow fair housing law.
Methodology
The Federal Reserve's Survey of Household Economics and Decisionmaking (SHED) for 2024 was fielded October 18 through October 31, 2024 on Ipsos's KnowledgePanel, a probability-based online panel, and had 12,295 respondents. Adults who said they (or their spouse or partner) pay rent, 3,206 respondents, were asked question R1 about eight possible reasons for renting.
Reason shares by year come from the Fed's published Table 40. Our tabulation of the 2024 public use file uses the Fed's main weight and reproduces all eight published 2024 shares to the whole percent before we group answers. Group shares are rounded once from unrounded values, so they may not add to exactly 100%.
If cheaper to rent and less financially risky were counted as constraints, 29% of renters would have chosen constraints without convenience or preferring to rent (our tabulation).
We checked the 2025 edition (report May 2026): its questionnaire does not include the reasons-for-renting question, so 2024 is the latest year available.
Source: Board of Governors of the Federal Reserve SystemSource: Board of Governors of the Federal Reserve SystemSource: Board of Governors of the Federal Reserve SystemSource: Board of Governors of the Federal Reserve SystemSource: Board of Governors of the Federal Reserve SystemSource: Board of Governors of the Federal Reserve System
Limitations
Keep these limits in mind when using the figures.
- The question was not asked in the 2025 survey, so these figures are about a year older than the Fed's newest housing data.
- The Fed does not publish margins of error for SHED estimates, and we did not test whether changes between years are statistically significant.
- Answers are self-reported. Shares are of adults, not households; a household with two adult renters counts as two renters in these estimates.
- Renters were not asked for their main reason, so the shares cannot be ranked by importance, and our groupings are a judgment about which reasons describe constraints.
- The Fed notes that people who join online panels may be more comfortable with the internet than adults overall, which could bias who responds.
- Adults who neither own nor pay rent, such as some who live with parents, were not asked this question.
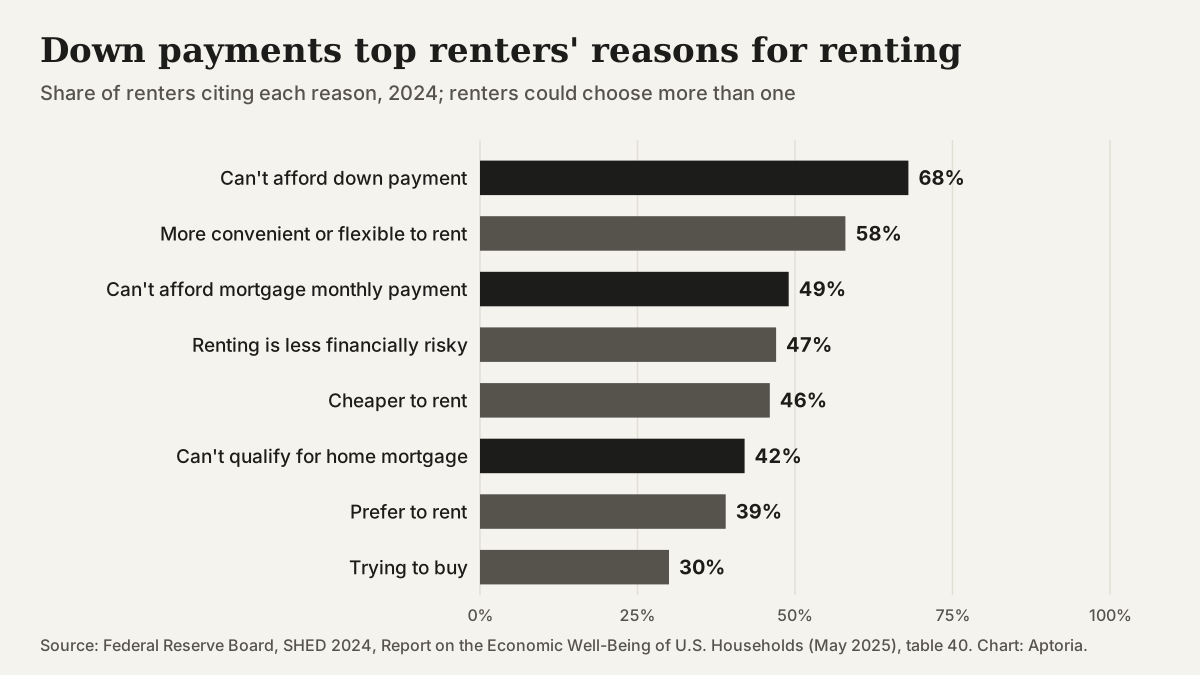
Share of renters citing each reason for renting, 2024. Source: Federal Reserve Board, Survey of Household Economics and Decisionmaking, Table 40.
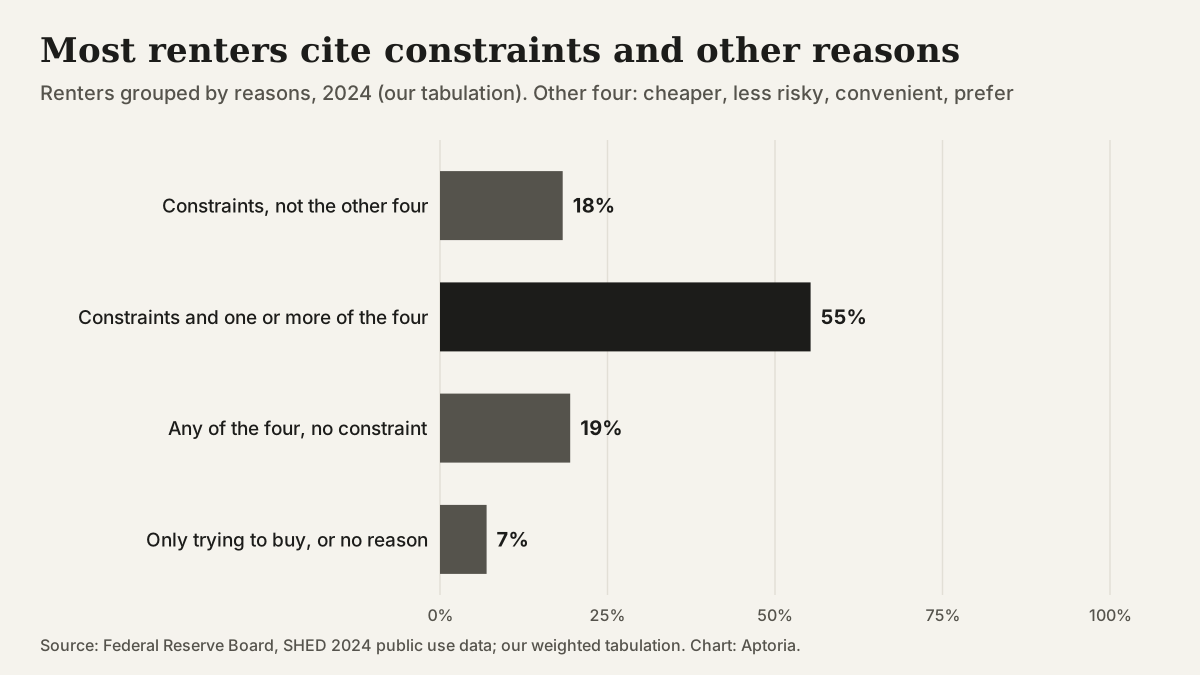
Renters grouped by the reasons they chose, 2024. Source: our weighted tabulation of the Federal Reserve Board's SHED 2024 public use data.
Questions that come up
Does the Fed's 2025 survey ask why people rent?
No. The 2025 edition, published in May 2026, does not include the question, so its housing chapter has no reasons-for-renting table. It reports that 27% of adults rented in 2025.
Who counts as a renter in this survey?
Adults who say they, or their spouse or partner, pay rent for their home. People who live somewhere without owning it or paying rent are counted separately and were not asked why they rent.
Why do the reasons add up to more than 100%?
Each reason is its own yes-or-no question, so renters can choose several. In 2024 renters chose 3.8 reasons on average, and 74% chose three or more.
Does this page show how many renters will buy a home soon?
No. Trying to buy (30% of renters) is a reason given for renting now, not a plan with a date. For trends in homeownership, see the page on the homeownership rate and renter demand.
Sources and references
Follow each source to check the underlying claim. Access checks and professional review are different steps.