The short answer
Yes, compared with two decades ago. Census's Table AD-1 shows 57.6% of 18- to 24-year-olds and 16.4% of 25- to 34-year-olds lived in a parent's home in 2025, up from 49.5% and 10.8% in 2005 (sexes combined by us). Our tabulation of the 2026 survey puts the shares at 60.0% and 17.9%.
Key takeaways
The key numbers
Census publishes Table AD-1 separately for men and women; the both-sexes shares here are our calculation from its counts. The 2026 row is our tabulation of the survey's public-use file, because Census has not yet published its 2026 tables.
| Year and source | Ages 18 to 24 | Ages 25 to 34 | Ages 18 to 34 |
|---|---|---|---|
| 2026, our tabulation of CPS ASEC | 60.0% (±1.2) | 17.9% (±0.9) | 34.7% (±0.8) |
| 2025, Census Table AD-1 | 57.6% | 16.4% | 33.0% |
| 2020, Census Table AD-1 | 58.2% | 17.8% | 33.6% |
| 2005, Census Table AD-1 | 49.5% | 10.8% | 26.9% |
| 1983, Census Table AD-1 | 54.4% | 10.6% | 29.2% |
| 1960, decennial census (in Table AD-1) | 43.0% | 9.1% | 22.5% |
How many young adults live with their parents?
More than half of 18- to 24-year-olds and about one in six 25- to 34-year-olds. In Census's 2025 figures, 57.6% of people aged 18 to 24 and 16.4% of those aged 25 to 34 were a child of the householder, which is how the survey identifies someone living in a parent's home. Census's own release rounds these to 58% and 16%. Across ages 18 to 34 that was 25.2 million people, or 33.0%.
The 2026 survey shows higher shares. By our tabulation of the public-use file, 60.0% of 18- to 24-year-olds (±1.2 points) and 17.9% of 25- to 34-year-olds (±0.9) lived in a parent's home, about 26.6 million people aged 18 to 34. Both rises from 2025 are larger than our approximate 90% margins. The 25 to 34 share is within our margin of error of the 17.8% Census reported for 2020, the highest in its survey series since 1983. The 2020 survey was collected as the pandemic began: Census suspended in-person interviews in March 2020, and the monthly survey's March response rate fell to 73%, about 10 points below usual.
In this data, living at home means living in a household where a parent is the householder, the person (or one of the people) in whose name the home is owned or rented. A young adult whose parent has moved into the young adult's own home is not counted, and Census counts unmarried college students living in dormitories as living in their parents' home.
Has living with parents become more common?
Yes, especially for people in their late twenties and early thirties. The 25 to 34 share stayed between about 10% and 13% from 1983 through the 1990s and reached a low of 10.2% in 2003. It then rose to 17.8% in 2020 and stood at 16.4% in 2025, about 60% above its 2003 level.
For 18- to 24-year-olds the change is smaller. The share was 54.4% in 1983, dipped to a low of 49.5% in 2005 and was 57.6% in 2025. The decennial census figures Census includes for 1960 (43.0% and 9.1%) come from a different source and are not directly comparable with the survey years.
These tables describe how living arrangements changed. They do not record why, and this page does not attribute the changes to any cause.
How does it differ by age?
The share falls steeply with age. In our 2026 tabulation, 60.0% of 18- to 24-year-olds lived in a parent's home, against 24.3% at 25 to 29 and 11.3% at 30 to 34. The rise from 2025 was statistically significant at 18 to 24 and 25 to 29; the decline at 30 to 34 fell just short of significance.
| Age group | 2025 survey | 2026 survey | Change, percentage points |
|---|---|---|---|
| Ages 18 to 24 | 57.6% (±1.2) | 60.0% (±1.2) | +2.4 (±1.7) |
| Ages 25 to 29 | 20.4% (±1.2) | 24.3% (±1.3) | +3.9 (±1.8) |
| Ages 30 to 34 | 12.7% (±0.9) | 11.3% (±1.1) | −1.4 (±1.4), not statistically significant |
Does it differ for men and women?
Yes. Census reports Table AD-1 for men and women separately, and men were more likely than women to live in a parent's home in both age groups: in 2025, 58.8% of men and 56.4% of women aged 18 to 24, and 19.2% and 13.6% at 25 to 34. Census's table does not include margins of error.
| Age group | Men | Women |
|---|---|---|
| Ages 18 to 24 | 58.8% | 56.4% |
| Ages 25 to 34 | 19.2% | 13.6% |
How have households changed?
There are more households, and they are smaller. Census counted 134.8 million households in 2025, against 52.8 million in 1960. The average household fell from 3.33 people to 2.50, and average adults per household from 2.12 to 1.96. One-person households were 29.5% of the total in 2025, by our calculation from Census's counts, up from 13.1% in 1960.
Census notes that its 2025 figures use new population controls, so changes in the number of people between 2024 and 2025 mix real change with a change in method. This page does not compare 2024 and 2025 counts.
| Year | Households | Average people per household | One-person households (share, our calculation) |
|---|---|---|---|
| 1960 | 52.8 million | 3.33 | 13.1% |
| 1980 | 80.8 million | 2.76 | 22.7% |
| 2000 | 104.7 million | 2.62 | 25.5% |
| 2025 | 134.8 million | 2.50 | 29.5% |
What could this mean for rental demand?
A young adult who lives in a parent's home is not heading a separate household. If more young adults moved out, that could add households, and so add to demand for housing, including rentals. How many would rent, share with roommates, live with a partner or buy, and when, is not something these tables can show.
For how many households rent and how renter households have changed, see the homeownership and renter demand page.
What this means for landlords
These are considerations to weigh against your own market and properties, not recommendations.
- Household formation is one influence on local rental demand among several, alongside population change and job growth, and new construction adds to supply. Local vacancy rates are a more direct read on your market.
- Some applicants moving out of a parent's home may be first-time renters with little rental history. Apply the same written screening criteria to every applicant and follow fair-housing law: familial status is protected under the federal Fair Housing Act, and some state and local laws also protect age.
- Some young adults moving out may share a unit. The roommate rent split calculator can help set out how rent and utilities divide in a shared unit.
- National shares describe groups. They do not tell you who will apply for a particular unit, and they are not a basis for choosing tenants.
Methodology
Published figures come from Census's historical Table AD-1 (1960 to 2025) and Tables HH-1, HH-4 and HH-6, released in December 2025 and based on the Current Population Survey's Annual Social and Economic Supplement. Table AD-1's 1960, 1970 and 1980 rows come from the decennial census. A young adult is counted as living at home when they are a child of the householder; Census defines own children to include stepchildren and adopted children. Where Census shows a year twice (in AD-1, 2011 and 2021; in the household tables, years such as 1980 and 1993), this page uses the row revised to the newer census-based population controls. Table AD-1 has no breakdown for 1981 and 1982.
The both-sexes shares are our calculation, adding Census's counts for men and women. In every row except 1996, Census's own percentages match its published counts within rounding; for 1996 they differ by up to a quarter of a point, and this page uses the counts.
Our 2024, 2025 and 2026 figures come from the CPS ASEC public-use person and replicate-weight files, weighted with the supplement weight (MARSUPWT), counting people aged 18 to 34 whose relationship to the householder is own child. Run on the 2024 and 2025 files, the same code matches Census's AD-1 percentages within 0.06 point; its counts of people are within 0.2% of Census's, with the largest gap 29 thousand for men aged 25 to 34 in 2025.
Standard errors use the 160 replicate weights and Census's formula, 4/160 times the sum of squared differences from the full-sample estimate; margins are 1.645 standard errors. Changes from 2025 to 2026 combine the two years' standard errors as if the samples were independent; consecutive survey samples overlap, which tends to make these margins conservative. Percentages are rounded once, from unrounded values.
Limitations
Read the numbers with these limits in mind.
- The 2026 figures are our tabulation, not official estimates. Census's 2026 tables had not been published as of October 24, 2026.
- College students in dormitories count as living in a parent's home, which raises the 18 to 24 share in particular.
- The measure counts young adults in a household headed by a parent. It does not count a young adult whose parent lives in the young adult's home, or one living with grandparents or other relatives.
- The survey does not ask why young adults live with their parents, and these tables are not split by tenure, so they do not show whether the parent's home is owned or rented.
- These are national figures. This page does not report states or metro areas.
- This page does not forecast household formation or rental demand.
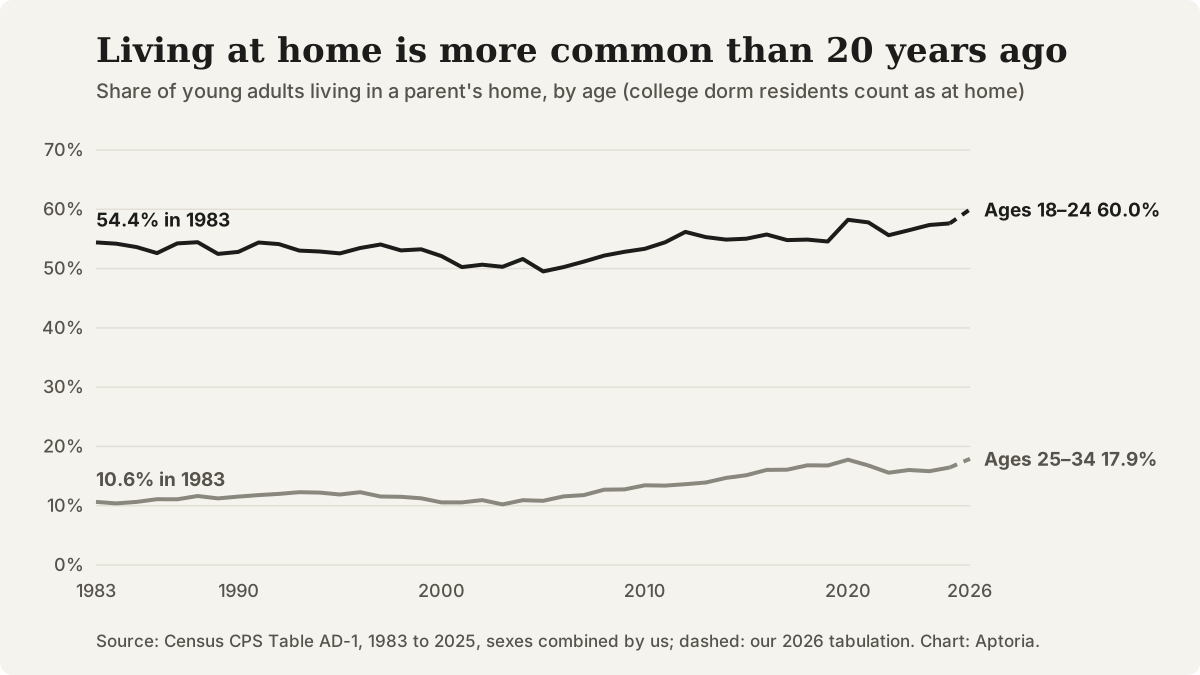
Share of young adults living in a parent's home, both sexes, 1983 to 2026. Source: U.S. Census Bureau, CPS Table AD-1 (1983 to 2025, sexes combined by us); 2026 (dashed) is our tabulation of the CPS ASEC public-use file.
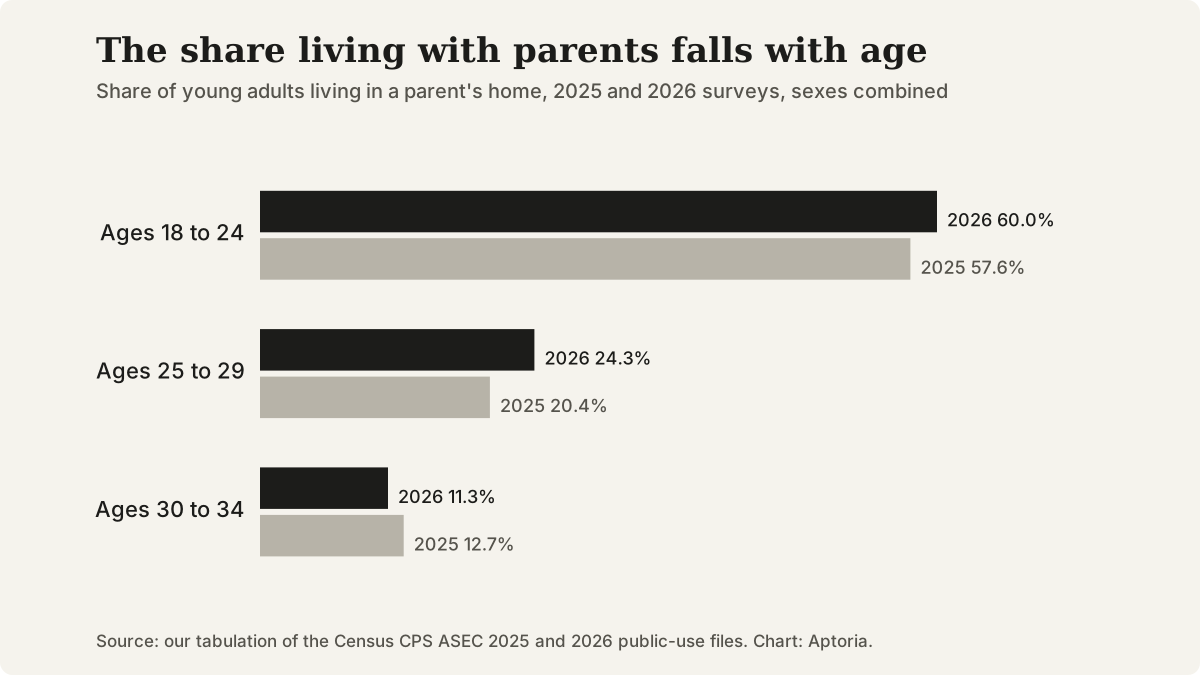
Share of young adults living in a parent's home by age group, 2025 and 2026 surveys. Source: our tabulation of the U.S. Census Bureau CPS ASEC public-use files.
Questions that come up
Does this page count college students in dorms as living at home?
Yes, following Census. In the survey, unmarried college students living in dormitories are counted as living in their parents' home, so the shares for 18- to 24-year-olds include them.
Does the survey say why young adults live with their parents?
No. Table AD-1 records living arrangements, not reasons, and this page does not attribute the trend to housing costs, jobs, school or any other cause.
When will Census publish official 2026 figures?
Census released its 2025 Families and Living Arrangements tables on December 2, 2025. If it follows a similar schedule, 2026 tables would appear late in 2026, and this page would then replace its own 2026 tabulation with them.
Does this page forecast how many young adults will move out?
No. It reports Census's historical figures and our tabulation of the latest survey file. Whether and when more young adults form their own households is not something these data predict.
Sources and references
Follow each source to check the underlying claim. Access checks and professional review are different steps.