The short answer
About one in six renters moves in a year. By our tabulation of Census's 2026 survey file, 15.7% of people in rented homes had moved within the past year, against 3.6% in owner-occupied homes. Census's latest published table shows 16.2% for 2023. In 1988, 35.2% of renters moved in a year.
Key takeaways
The key numbers
Rows labelled as our tabulation come from Census's public-use survey files. The same method reproduces Census's published 2023 tables exactly, in thousands, but Census has not published its own tables for 2024, 2025 or 2026. Margins are approximate 90% intervals from the survey's replicate weights.
| Measure | Renter-occupied homes | Owner-occupied homes | Source |
|---|---|---|---|
| Moved in the past year, 2026 survey (people 1 year and older) | 15.7% (±0.7) | 3.6% (±0.2) | Our tabulation of CPS ASEC |
| Moved in the past year, householders, 2026 survey | 16.1% (±0.6) | 3.2% (±0.2) | Our tabulation of CPS ASEC |
| Moved in the past year, 2023 (latest Census table) | 16.2% | 4.1% | Census Table A-4 |
| Moved in the past year, 1988 | 35.2% | 9.5% | Census Table A-4 |
| Householders in the same home as five years earlier, 2025 survey | 45.4% (±0.8) | 80.2% (±0.4) | Our tabulation of CPS ASEC |
How often do renters move?
About one in six each year, on the latest data. The Current Population Survey's Annual Social and Economic Supplement asks where each person lived one year earlier. In the 2026 survey, 15.7% of people living in renter-occupied homes had lived somewhere else a year before (±0.7 points), by our tabulation. For people in owner-occupied homes the share was 3.6%, so renters moved at more than four times the owner rate.
Counting one person per household gives a similar picture. Among renter householders, usually the person in whose name the home is rented, 16.1% had moved in the past year, against 3.2% of owner householders. In other words, roughly one in six renter householders had moved into their current home within the past year.
Census's own latest table, for 2023, shows 16.2% of renters moving, the same as in 2022. Census released that table package in December 2024 and has not published a package for any later year.
Has renter mobility changed over time?
It has fallen by more than half since the late 1980s. Census's tenure series starts in 1988, when 35.2% of people in rented homes moved in a year. The rate drifted down through the 2000s and 2010s and reached a low of 15.9% in 2021 (16.0% on the older 2010-based population controls). Owners also moved less, from 9.5% in 1988 to 4.1% in 2023.
Recent years have moved around. In our tabulations the renter rate rose to 17.5% in 2024 and 18.7% in 2025, then fell back to 15.7% in 2026. The 2.9-point drop from 2025 to 2026 is larger than our approximate 90% margin of ±0.9 points, while the 2026 rate is not significantly different from Census's 2023 figure. Treat any single year with caution until Census publishes its own tables for these years.
Census's Table A-1 notes that the question changed in 2004. Before then it asked about residence on March 1 of the previous year, and since then it has asked about residence one year ago. Tenure data are not available for 1995.
How many renters have lived in their home five years or longer?
A little under half of renter households had been in their home at least five years, on the latest five-year data. The 2025 survey also asked where people lived five years earlier; the 2026 survey did not. By our tabulation, 45.4% of renter householders lived in the same home as five years before, against 80.2% of owner householders. Counting everyone aged 5 and older in rented homes, the share was 46.5%.
The question compares two points in time. A household that moved away and came back within the five years counts as living in the same home.
Why do renters move?
Housing reasons lead. Among people in rented homes who moved in the year before the 2026 survey, 39.3% gave a housing-related main reason, by our tabulation. The most common single reasons were wanting a new or better home (15.7%), a new job or job transfer (12.8%) and cheaper housing (11.5%); the last two are within the margin of each other.
Job reasons (22.3%) and family reasons (21.8%) were within the margin of each other, and together cover 44.0% of renter moves. Renters who moved were more likely than owners who moved to give a job-related reason. The groups follow Census's own definitions; a relationship with an unmarried partner, for example, is counted under other reasons.
The survey records each person's main reason in their own answer. Tenure describes the home people moved into, so these are people now renting, including some who left owned homes or came from abroad. It does not say whether a move had anything to do with a particular landlord or home.
| Reason | Renter-occupied homes | Owner-occupied homes |
|---|---|---|
| Housing-related (all) | 39.3% (±2.1) | 43.5% (±3.2) |
| Wanted a new or better home | 15.7% (±1.7) | 12.5% (±2.1) |
| Cheaper housing | 11.5% (±1.4) | 5.9% (±1.6) |
| Wanted a better neighborhood | 6.7% (±1.2) | 4.7% (±1.5) |
| Job-related (all) | 22.3% (±1.9) | 14.2% (±2.0) |
| New job or job transfer | 12.8% (±1.5) | 7.1% (±1.5) |
| Closer to work or easier commute | 6.9% (±0.9) | 2.5% (±1.0) |
| Family-related (all) | 21.8% (±1.8) | 27.9% (±2.4) |
| To set up own household | 9.4% (±1.4) | 10.8% (±1.8) |
| Other reasons (all) | 16.6% (±1.6) | 14.3% (±2.1) |
How far do renters move?
Mostly not far. Of renters who moved in the year before the 2026 survey, 58.0% came from somewhere in the same county and 20.9% from another county in the same state, so about four in five stayed within their state. 16.4% came from another state, and 4.8% from abroad.
For state-level migration patterns, which are not split by tenure, see the population and migration trends page.
| Previous home | Share of renter movers |
|---|---|
| Same county | 58.0% (±2.1) |
| Different county, same state | 20.9% (±1.8) |
| Different state | 16.4% (±1.5) |
| Abroad (including Puerto Rico and U.S. Island Areas) | 4.8% (±1.2) |
Do renters move more at every age?
Yes. The gap holds within age groups. By our calculation from Census's 2023 Table 5 counts, people in rented homes moved more often than people in owned homes in every age group shown: 28.6% against 8.7% at ages 20 to 29, and 9.4% against 2.6% at 45 and older.
These are national survey results for groups, not a way to judge any applicant or tenant. Apply the same written criteria to every applicant and follow fair-housing law, which in many places covers age and familial status.
What this means for landlords
These are considerations to weigh against your own tenants, leases and market, not recommendations.
- About one in six renter householders had moved into their home within the past year. That is not a turnover rate for any one property, but it suggests that even a small portfolio can see move-outs in an ordinary year. The cost of tenant turnover calculator can help put a number on what a vacancy and make-ready cost you.
- Long stays are also common: 45.4% of renter householders were in the same home as five years earlier.
- Housing-related reasons, such as wanting a better home or cheaper housing, were the largest group among people who moved into rented homes. The survey does not ask about a landlord or a unit's condition, but some housing factors, such as price and the home itself, may be ones an owner can affect; job and family moves mostly are not.
- Starting the renewal conversation well before the lease ends gives both sides time to decide. Notice periods for rent increases and non-renewal vary by state and locality, so check local rules. The lease renewal calculator compares a renewal offer with the cost of turning the unit.
- Most moves into rented homes were local: about four in five renter movers came from the same state. A tenant weighing a move may often be choosing among nearby options.
- National rates describe groups. They do not tell you which tenant will leave, and they are not a basis for choosing tenants.
Methodology
Published figures come from Census's historical Tables A-1 and A-4 (through 2023) and its 2023 detailed Tables 5, 7 and 13. A mover is a person who lived in a different home exactly one year before the survey; the universe is people 1 year and older living in the United States outside institutions who are civilian adults or live with at least one civilian adult, as in Census's tables. Renter-occupied homes include those occupied without cash rent.
Our 2024, 2025 and 2026 figures come from the CPS ASEC public-use person, household and replicate-weight files, weighted with the supplement weight (MARSUPWT). Householders are household reference persons, excluding group quarters with only unrelated individuals, which matches Census's Table 7. Reason groups follow the definitions in Census's Table 13. Run on the 2023 file, the same code reproduces Census's published 2023 numbers for movers, types of move, householders and reasons by tenure, in thousands.
Standard errors use the 160 replicate weights and Census's formula, 4/160 times the sum of squared differences from the full-sample estimate; margins are 1.645 standard errors. Year-to-year changes combine the two years' standard errors as if the samples were independent, which ignores the overlap between consecutive CPS samples; because overlapping samples tend to be positively correlated, the margins on changes are likely conservative. Percentages are rounded once, from unrounded values.
Limitations
Read the numbers with these limits in mind.
- Census has not published CPS mobility tables for 2024, 2025 or 2026, so those figures are our tabulations, not official estimates.
- Surveys disagree on the level. The American Community Survey, a separate and larger Census survey, put the share of all people who moved at 11.8% in 2024, while the CPS figure for 2024 in our tabulation is 7.9%. Compare figures from the same survey.
- Person-level rates include children, and tenure describes the home where people live now, not the one they left.
- Reasons for moving are each person's self-reported main reason.
- These are national figures. This page does not report rates for states or metro areas.
- The latest data describe moves in the year before the 2026 survey; the five-year figures come from the 2025 survey. This page does not forecast tenant turnover.
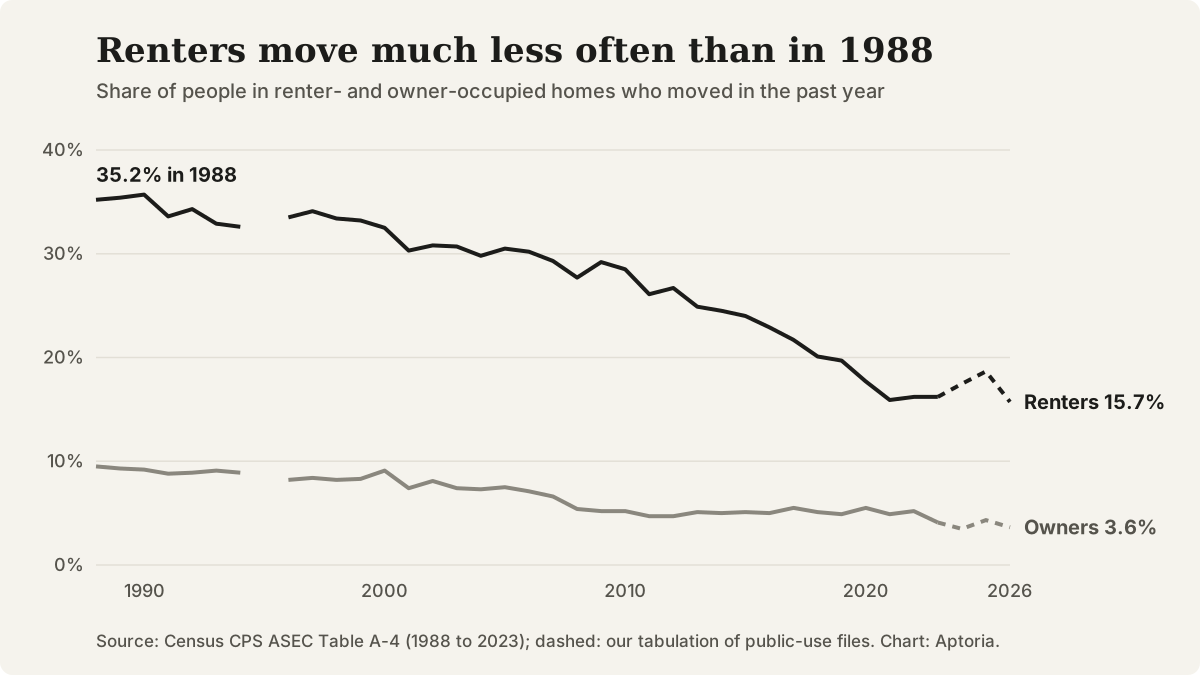
Share of people in renter- and owner-occupied homes who moved in the past year, 1988 to 2026. Source: U.S. Census Bureau, CPS ASEC Table A-4 (1988 to 2023); 2024 to 2026 (dashed) are our tabulation of the public-use files.
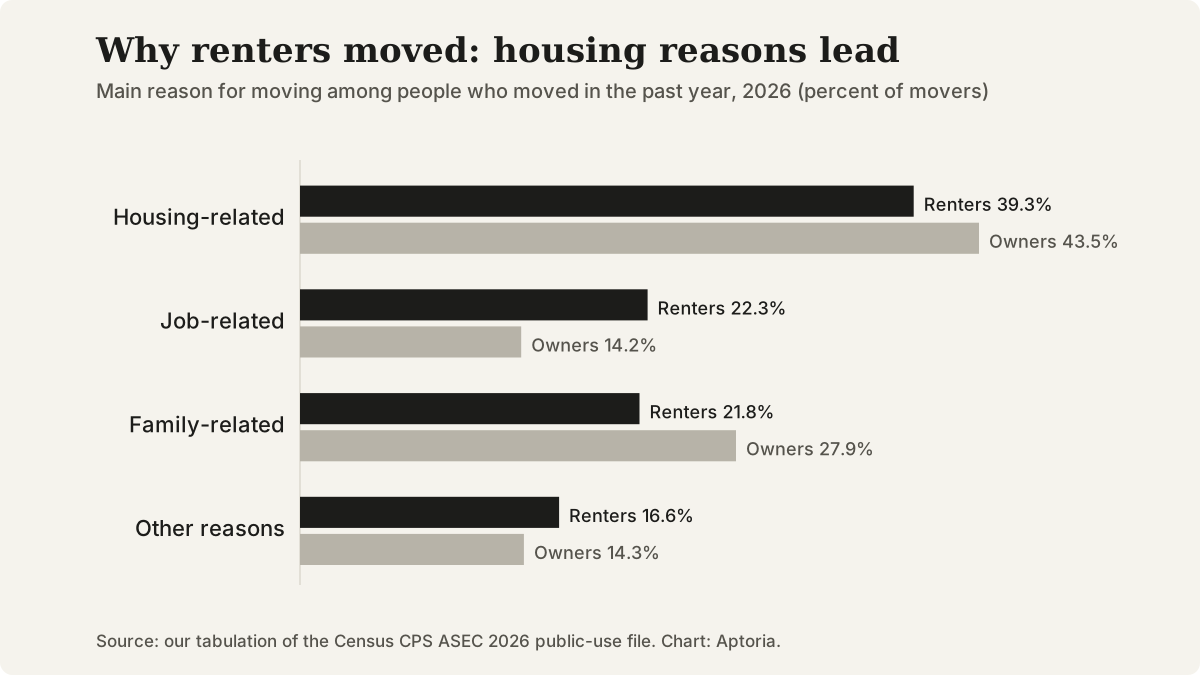
Main reason for moving among people who moved in the past year, by housing tenure, 2026 survey. Source: our tabulation of the U.S. Census Bureau CPS ASEC 2026 public-use file.
Questions that come up
What counts as a move in this data?
Living in a different home than exactly one year before the survey. A move across the street counts the same as a move across the country, and a person who moved more than once in the year counts once.
Why does this page show a 2026 figure when Census's latest table is for 2023?
Census posts the survey's public-use files each fall but has not published mobility tables for 2024, 2025 or 2026. We tabulated those files ourselves; the same method reproduces Census's published 2023 numbers, but the 15.7% for 2026 is not an official estimate.
Do renters move more than homeowners?
Yes, by a wide margin. In the 2026 survey, 15.7% of people in rented homes had moved in the past year against 3.6% in owned homes, by our tabulation, and Census's 2023 table shows renters moving more in every age group.
How often is this data updated?
Census releases the supplement's public-use files each fall; the 2026 dataset page was last revised in September 2026. Census's own mobility table packages come out less regularly; the latest, for 2023, was released in December 2024.
Sources and references
Follow each source to check the underlying claim. Access checks and professional review are different steps.