The short answer
The U.S. population grew 0.5% to 341.8 million in the year to July 1, 2025, about half the prior year's pace, according to Census estimates released January 27, 2026. Net international migration fell from 2.7 million to 1.3 million. South Carolina, Idaho and North Carolina grew fastest, and five states lost population.
Key takeaways
The key numbers
These are the Census Bureau's Vintage 2025 estimates. Population figures are for July 1; the components cover July 1 through June 30. All comparisons on this page stay within Vintage 2025, as Census advises.
| Measure | Year to July 2025 | Year to July 2024 |
|---|---|---|
| Population on July 1 | 341.8 million | 340.0 million |
| Population change | +1,781,060 (+0.5%) | +3,248,745 (+1.0%) |
| Natural change (births minus deaths) | +518,858 | +514,277 |
| Net international migration | +1,262,202 | +2,734,468 |
| States that lost population | 5 | 2 |
| States with positive net domestic migration | 31 | 27 |
How fast is the U.S. population growing?
More slowly than a year earlier. The population rose by 1,781,060 people, or 0.5%, in the year to July 1, 2025, after rising 3,248,745, or 1.0%, the year before.
Natural change was about the same in both years, 518,858 versus 514,277. Net international migration fell 53.8%, from 2,734,468 to 1,262,202. Census officials described that drop as the main reason growth slowed.
Since the April 2020 estimates base, the population is up 3.1%.
| Year | Natural change | Net international migration | Total change |
|---|---|---|---|
| 2020–21 | +146,036 | +376,026 | +522,062 |
| 2021–22 | +224,026 | +1,672,112 | +1,896,138 |
| 2022–23 | +494,611 | +2,264,137 | +2,758,748 |
| 2023–24 | +514,277 | +2,734,468 | +3,248,745 |
| 2024–25 | +518,858 | +1,262,202 | +1,781,060 |
Which states are growing fastest?
South Carolina grew fastest at 1.5%, followed by Idaho (1.4%) and North Carolina (1.3%). In each of the first three, net domestic migration accounted for more than half of the gain (83%, 69% and 58%). Texas's gain was split among international migration (43%), natural change (40%) and domestic migration (17%), while natural change made up 69% of Utah's.
In raw numbers, Texas added the most people (391,243), followed by Florida (196,680) and North Carolina (145,907).
| State | Change | Percent | Natural change | Net domestic migration | Net international migration |
|---|---|---|---|---|---|
| South Carolina | +79,958 | +1.5% | +564 | +66,622 | +12,930 |
| Idaho | +28,861 | +1.4% | +6,900 | +19,915 | +2,148 |
| North Carolina | +145,907 | +1.3% | +15,129 | +84,064 | +46,890 |
| Texas | +391,243 | +1.2% | +157,711 | +67,299 | +167,475 |
| Utah | +35,921 | +1.0% | +24,961 | +3,343 | +7,501 |
Which states are losing population?
Five states had fewer residents on July 1, 2025 than a year earlier: California, Hawaii, New Mexico, Vermont and West Virginia. The declines were small, from 9,465 people in California (−0.02%) to 1,255 in West Virginia.
The components differ. California lost 229,077 residents to other states on net, which was largely offset by natural change and international migration. New Mexico, Vermont and West Virginia had more deaths than births.
Where are people moving within the U.S.?
On net, more people moved into than out of 31 states from elsewhere in the country, up from 27 a year earlier. The largest gains were in North Carolina (84,064), Texas (67,299) and South Carolina (66,622). The largest net losses were in California (229,077), New York (137,586) and Illinois (40,017).
Florida's net domestic gain has shrunk: 310,892 in the year to July 2022, 183,646 in 2023, 58,411 in 2024 and 22,517 in 2025, which ranked 8th among states.
By region, net domestic migration was +357,790 for the South and +16,040 for the Midwest, which Census pointed out was the Midwest's first year of net domestic gains in the 2020s. It was −205,552 for the Northeast and −168,278 for the West.
Treat these domestic migration figures with some caution. Census says its 2025 estimates used only part of the tax-return data it normally relies on for people under 65, and carried over the prior year's migration rates for people 65 and older, so the state counts, Florida's rank and the regional figures may shift in the next vintage.
| State | Net domestic migration | Total population change |
|---|---|---|
| North Carolina | +84,064 | +145,907 |
| Texas | +67,299 | +391,243 |
| South Carolina | +66,622 | +79,958 |
| Tennessee | +42,389 | +63,785 |
| Arizona | +31,107 | +67,394 |
| California | −229,077 | −9,465 |
| New York | −137,586 | +1,008 |
| Illinois | −40,017 | +16,108 |
| New Jersey | −37,428 | +41,861 |
| Massachusetts | −33,340 | +15,524 |
Which large metro areas are growing?
Among the 56 metro areas with at least 1 million residents, Raleigh, NC grew fastest (2.4%), followed by Austin, TX and Charlotte, NC-SC. Six lost population: Los Angeles, CA; Memphis, TN-MS-AR; San Diego, CA; Miami, FL; Buffalo, NY; and Pittsburgh, PA.
Half of these metros (28 of 56) had net domestic out-migration, meaning more residents moved to other parts of the country than arrived from them. The same 2025 data caveat on domestic migration applies to these metro figures.
| Metro area | Percent change | Change | Net domestic migration |
|---|---|---|---|
| Raleigh-Cary, NC | +2.4% | +36,793 | +19,974 |
| Austin-Round Rock-San Marcos, TX | +2.1% | +53,796 | +19,860 |
| Charlotte-Concord-Gastonia, NC-SC | +1.9% | +54,122 | +24,404 |
| Houston-Pasadena-The Woodlands, TX | +1.6% | +126,720 | +7,308 |
| Nashville-Davidson--Murfreesboro--Franklin, TN | +1.6% | +34,658 | +16,967 |
| Los Angeles-Long Beach-Anaheim, CA | −0.48% | −62,454 | −130,828 |
| Memphis, TN-MS-AR | −0.31% | −4,217 | −10,302 |
| San Diego-Chula Vista-Carlsbad, CA | −0.16% | −5,294 | −23,876 |
| Miami-Fort Lauderdale-West Palm Beach, FL | −0.14% | −8,909 | −113,724 |
| Buffalo-Cheektowaga, NY | −0.13% | −1,510 | −2,345 |
| Pittsburgh, PA | −0.13% | −3,160 | +1,659 |
How much have states changed since 2020?
Over the five-plus years from the April 2020 estimates base to July 2025, Idaho grew the most (10.4%), followed by Florida (8.93%), South Carolina (8.83%) and Texas (8.78%). Hawaii and West Virginia had the largest declines, each about 1.5%.
What this means for landlords
Population is one input to rental demand. These are considerations to weigh with local data, not recommendations.
- A growing population adds potential renters, but rent and vacancy also depend on how much new housing is being built and on local incomes.
- Net domestic migration shows where people are moving within the country, which can matter for rental demand in a specific market more than the national total.
- Slower international migration lowers national population growth. How that affects a given market depends on how much of its growth came from that source; the component tables above show the mix by state.
- State and metro totals hide large differences between neighborhoods. Check local listings, vacancy and time to lease for your own units.
Methodology
We pull the Census Bureau's published Vintage 2025 files for states and metro areas and compute every change, ranking and share from them, with rounding applied once to the unrounded values. Only Census's published files were used; the Census data API was not used.
Population changes run from July 1, 2024 to July 1, 2025; the components run from July 1, 2024 to June 30, 2025. States include the District of Columbia; Puerto Rico is excluded from state rankings. Metro areas are the Census Bureau's metropolitan statistical areas with at least 1 million residents in 2025.
Limitations
Keep these limits in mind.
- These are estimates built from administrative records and surveys, not counts. Census revises the whole series back to 2020 with each new vintage, so compare years only within the same vintage, as this page does.
- Census says its Vintage 2025 international migration estimates include methodological changes, among them additional administrative data and higher estimates of emigration for the latest year.
- For 2025, Census received only part of the tax-return data it normally uses for domestic migration, and migration rates for people 65 and older reflect the prior year because Medicare data were not available.
- State totals combine very different local markets.
- This page does not forecast population or demand, and it does not use Census's own projection of next year's international migration.
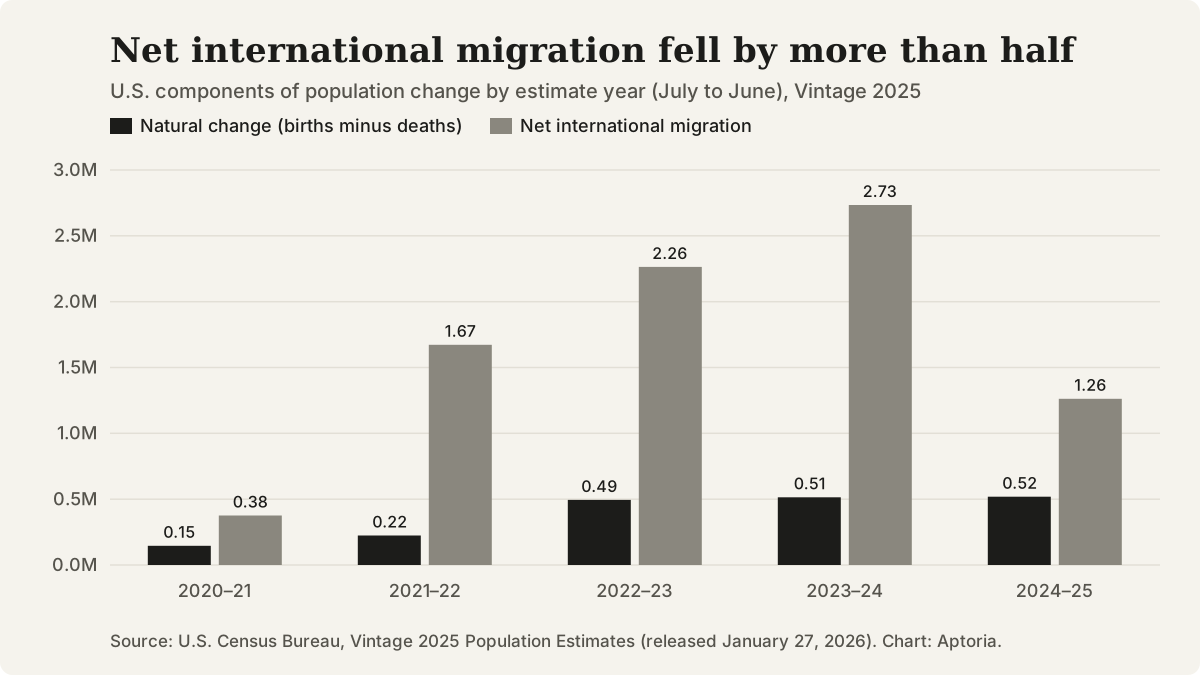
U.S. natural change and net international migration by estimate year, July 2020 to June 2025. Source: U.S. Census Bureau, Vintage 2025 Population Estimates.
Questions that come up
What is net domestic migration?
It is the number of people who moved into an area from elsewhere in the United States minus the number who moved out to elsewhere in the country. In the Vintage 2025 figures, the state totals net to zero.
Can I compare these estimates with last year's published numbers?
Not directly. Census revises the entire series each year and advises comparing years only within one vintage, which is what this page does with Vintage 2025.
When does Census update these estimates?
Once a year. National and state estimates came out on January 27, 2026, and metro and county estimates on March 26, 2026, both for July 1, 2025.
Does population growth mean rents will rise where I own?
Not on its own. Rents also depend on new supply, vacancy and incomes. Our pages on rental vacancy by metro and the housing market cover those measures.
Sources and references
Follow each source to check the underlying claim. Access checks and professional review are different steps.