The short answer
Few do. As of August 3, 2026, the National Flood Insurance Program had 3.16 million residential policy contracts in force, covering about 2.9% of the nation's residential buildings by our sum of FEMA's county data. Coverage is concentrated in a few Gulf and Atlantic states: 22% of buildings in Louisiana and 14% in Florida, but under 1% in 24 states. Private flood policies are not counted.
Key takeaways
The key numbers
FEMA publishes how many residential buildings in each county have a National Flood Insurance Program (NFIP) policy, and the claims the program has recorded. These figures cover the federal program only. FEMA does not have data on private flood insurance, so total flood coverage is higher than shown here by an unknown amount.
| Measure | Value | Note |
|---|---|---|
| Residential policy contracts in force | 3,161,236 | NFIP only; private flood insurance not included |
| Residential buildings in FEMA's structure inventory | 109.3 million | National Structure Inventory 2022 |
| Share of residential buildings with an NFIP policy | 2.9% | Our sum of FEMA's county rows |
| Residential contracts in high-risk flood areas | 1,839,454 (58% of contracts) | Special Flood Hazard Area |
| Share of residential contracts in Florida, Texas and Louisiana | 60% | Florida alone: 33% |
| Claims with a year of loss from 2016 to 2025 | 586,148 | 80% had a payment, our tally |
| Amount paid on those claims | $36.8 billion | Current dollars, not adjusted for inflation |
How many homes have flood insurance?
The NFIP had 3,161,236 residential policy contracts in force as of August 3, 2026, which FEMA describes as a good approximation of the number of insured buildings; a condominium association's building policy counts once even though it covers many units. Against FEMA's count of 109.3 million residential buildings, that is about 2.9%, or roughly one building in 35, our calculation.
Most of those policies are in high-risk areas. Of the total, 1,839,454 residential contracts, or 58%, are on buildings in the Special Flood Hazard Area, which federal rules define as land subject to a 1% or greater chance of flooding in any given year. The other 1.32 million are outside it.
Which states have the most flood insurance?
Louisiana has the highest share, with 22.0% of residential buildings insured through the NFIP, followed by Florida at 13.7%, South Carolina at 6.1%, Texas at 5.8% and New Jersey at 5.0%. Those are the only five states at 5% or more. The median across the 50 states and D.C. is 1.1%, and 24 states are under 1%; Minnesota is lowest at 0.2%.
By count, Florida alone holds 33% of the nation's residential NFIP contracts (1,040,662), and Florida, Texas and Louisiana together hold 60%. These state figures are our sums of FEMA's county rows.
| State | Share of residential buildings insured | Residential contracts in force | Share of U.S. contracts |
|---|---|---|---|
| Louisiana | 22.0% | 359,013 | 11.4% |
| Florida | 13.7% | 1,040,662 | 32.9% |
| South Carolina | 6.1% | 121,417 | 3.8% |
| Texas | 5.8% | 504,816 | 16.0% |
| New Jersey | 5.0% | 121,462 | 3.8% |
| Delaware | 4.8% | 17,547 | 0.6% |
| Hawaii | 3.9% | 11,829 | 0.4% |
| Mississippi | 3.5% | 40,954 | 1.3% |
| Rhode Island | 2.7% | 8,360 | 0.3% |
| Virginia | 2.7% | 72,514 | 2.3% |
| Michigan | 0.4% | 16,036 | 0.5% |
| Utah | 0.3% | 3,169 | 0.1% |
| Minnesota | 0.2% | 5,166 | 0.2% |
| United States (50 states and D.C.) | 2.9% | 3,161,236 | 100% |
How much does the NFIP pay in flood claims?
From 2016 through 2025, the NFIP recorded 586,148 claims and paid $36.8 billion on them, our tally of FEMA's redacted claims data in current dollars. About 80% of those claims had a payment.
Payments are uneven from year to year. Losses in 2017 drew $10.7 billion, 2012 drew $9.7 billion and 2024 drew $8.8 billion, while most other years from 2006 on were under $3 billion. Figures for 2024 and 2025 may still change. FEMA says the dataset is updated about monthly and lags the program's system of record. Some recent claims may also not yet be fully paid.
| Year of loss | Claims | Amount paid |
|---|---|---|
| 2016 | 85,497 | $4.5 billion |
| 2017 | 145,681 | $10.7 billion |
| 2018 | 42,625 | $1.6 billion |
| 2019 | 35,312 | $1.5 billion |
| 2020 | 33,185 | $0.9 billion |
| 2021 | 46,699 | $2.0 billion |
| 2022 | 60,262 | $5.3 billion |
| 2023 | 21,690 | $1.0 billion |
| 2024 | 102,054 | $8.8 billion |
| 2025 | 13,143 | $0.6 billion |
Where are flood claims paid?
Florida received 42% of NFIP claim payments for losses from 2016 to 2025, and Florida, Texas and Louisiana together received 84%, our tally.
| State | Claims | Amount paid | Share of U.S. payments |
|---|---|---|---|
| Florida | 199,277 | $15.5 billion | 42.1% |
| Texas | 137,995 | $11.2 billion | 30.5% |
| Louisiana | 71,293 | $4.3 billion | 11.6% |
| North Carolina | 32,329 | $1.3 billion | 3.5% |
| New Jersey | 14,317 | $0.5 billion | 1.4% |
| South Carolina | 15,590 | $0.4 billion | 1.2% |
| New York | 11,892 | $0.3 billion | 0.9% |
| Pennsylvania | 8,433 | $0.3 billion | 0.8% |
What do the claims data say about rental property?
Single-family homes, including mobile and manufactured homes, account for most claims: 82% of claims from 2016 to 2025, our grouping of FEMA's occupancy codes. Policies on residential buildings with 2 to 4 units had 18,881 claims and policies on residential buildings with 5 or more units had 12,844, with $2.09 billion paid between them. Condominium associations, single units within multi-unit buildings and nonresidential buildings are counted separately.
FEMA's claims data also flag rental properties. In 2024, 8.9% of claims were on properties flagged as rentals. The flag was set on fewer than 0.5% of claims in every year from 2006 to 2012 and rose gradually after that. The data do not say whether that reflects more rentals or a change in how the flag was recorded, so we do not show a trend.
What does an NFIP policy cover for a rental owner?
Federal rules set the limits. Under 44 CFR 61.6, an NFIP building policy in the regular program can cover up to $250,000 for a single-family or 2 to 4 unit building and up to $500,000 for other residential buildings, including multifamily buildings. Residential contents coverage is capped at $100,000, and contents limits are not per building, so a tenant can buy a separate contents policy for their own belongings.
The standard Dwelling Form, used for one to four family buildings, pays only for direct physical loss by flood. Its exclusions list loss of revenue or profits and loss of use of the property. The General Property Form, used for multifamily buildings with five or more units that are not condominiums, lists the same exclusions. New coverage generally starts 30 days after purchase, under 44 CFR 61.11, though there is no wait when coverage is bought while making, increasing, extending or renewing a loan.
Congress must periodically renew the program. As of October 24, 2026, FEMA says the NFIP's current authorization runs to December 11, 2026.
Source: Electronic Code of Federal Regulations (Office of the Federal Register)Source: Electronic Code of Federal Regulations (Office of the Federal Register)Source: Electronic Code of Federal Regulations (Office of the Federal Register)Source: Electronic Code of Federal Regulations (Office of the Federal Register)Source: Federal Emergency Management AgencySource: Federal Emergency Management Agency
What this means for landlords
These are considerations, not insurance advice. Coverage needs and lender requirements depend on the property, its flood zone and the loan, so talk with a licensed insurance professional about a specific building.
- FloodSmart says most homeowners and renters policies do not cover flood damage. It may be worth checking whether any policy on a rental excludes flood before assuming it is covered.
- Outside high-risk zones, NFIP coverage is rare. About 1.32 million residential buildings outside the Special Flood Hazard Area have NFIP policies, about 1.2% of all residential buildings by our calculation.
- FloodSmart says building and contents coverage are typically bought separately and have separate deductibles. A landlord's building policy does not cover a tenant's belongings; tenants can buy their own contents coverage.
- The Dwelling Form lists loss of revenue or profits among its exclusions. Ask a licensed insurance professional how that applies to lost rent and whether any other coverage could apply.
- Under the 30-day rule, a new policy bought shortly before a flood generally will not be in force yet unless an exception applies, such as buying it when making, increasing, extending or renewing a loan.
- Nationally, claim payments come in a few heavy years: 2017, 2012 and 2024 together drew $29.2 billion. The operating reserve glossary entry and the cash flow calculator linked below cover reserve planning in general.
Methodology
Coverage figures come from FEMA's NFIP Residential Penetration Rates dataset, with county counts as of August 3, 2026. FEMA counts residential policy contracts in force from the program's system of record and residential structures from the National Structure Inventory 2022. We added the county rows to get state and national totals and divided contracts by structures. 372 contracts listed under unknown counties have no structure count; they are in the contract totals but left out of the rates.
Claims figures come from FEMA's NFIP Redacted Claims dataset, version 3, which FEMA describes as claims transactions. We pulled every claim record with a year of loss from 2006 to 2025 through the OpenFEMA API, checked each year's row count against the API's own count, and added the amounts paid on building, contents and increased cost of compliance coverage. Amounts are in current dollars and are not net of later recoveries. Occupancy groups combine FEMA's older and newer occupancy codes.
Program rules come from the Electronic Code of Federal Regulations as of October 22, 2026, FEMA's FloodSmart site and FEMA's NFIP reauthorization page. FEMA's dataset descriptions and field definitions come from the OpenFEMA metadata service.
Source: Federal Emergency Management AgencySource: Federal Emergency Management AgencySource: Federal Emergency Management AgencySource: Electronic Code of Federal Regulations (Office of the Federal Register)Source: Electronic Code of Federal Regulations (Office of the Federal Register)Source: Electronic Code of Federal Regulations (Office of the Federal Register)Source: Electronic Code of Federal Regulations (Office of the Federal Register)Source: Federal Emergency Management AgencySource: Federal Emergency Management Agency
Limitations
Read the figures with these limits in mind.
- Private flood insurance is not included. FEMA says private take-up rates are not available to it, so the share of buildings with any flood coverage is higher than the NFIP share by an unknown amount.
- FEMA warns that incomplete structure counts in some counties can understate the building stock and inflate penetration rates.
- We do not report a high-risk-area penetration rate. In the file, 27 counties have high-risk rates above 100% and 593 counties show high-risk contracts but no high-risk structures, so the high-risk structure counts are not reliable enough to divide by.
- Contracts in force approximate insured buildings, not housing units. A condominium association policy counts once, and the counts do not say whether a building is rented.
- The claims data are redacted, lag the system of record, and are not an official federal report, according to FEMA. Recent years can still change as claims are reported and closed.
- Dollar amounts are not adjusted for inflation, so payments in earlier years are not directly comparable with recent ones.
- The rental flag was set on very few claims before 2013, and FEMA's data do not explain why, so it is a rough guide for recent claims only and may not capture every rental.
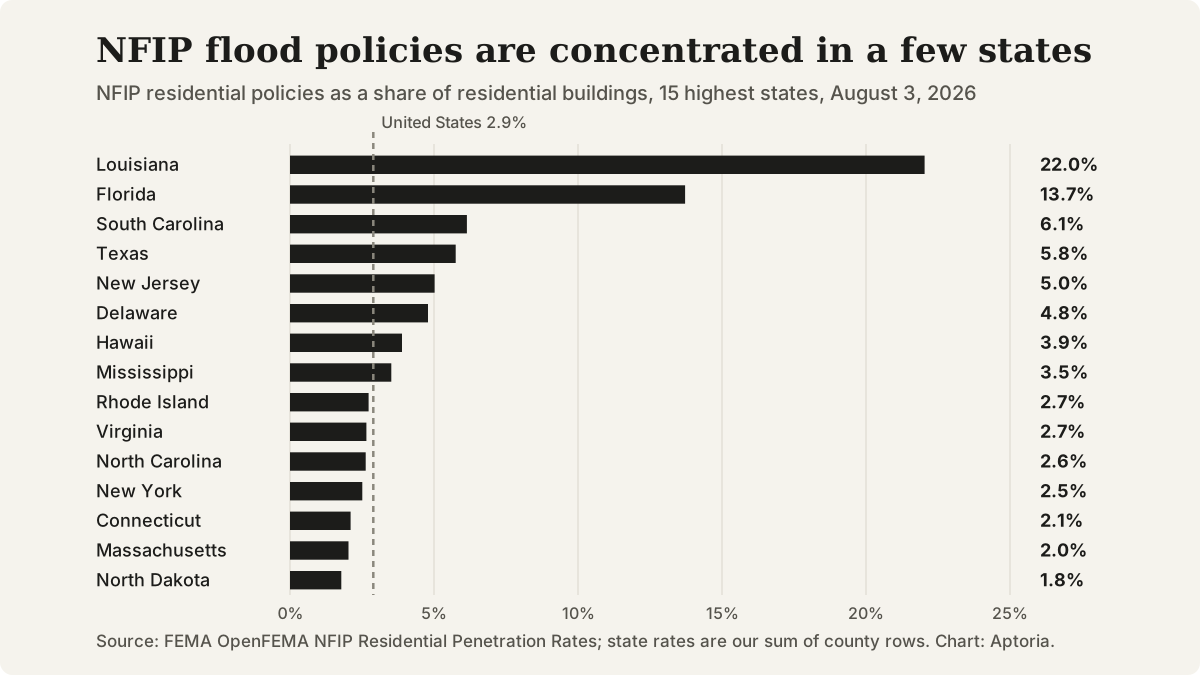
Share of residential buildings with an NFIP policy, 15 highest states, August 3, 2026. Source: FEMA OpenFEMA NFIP Residential Penetration Rates; state rates are our sums.
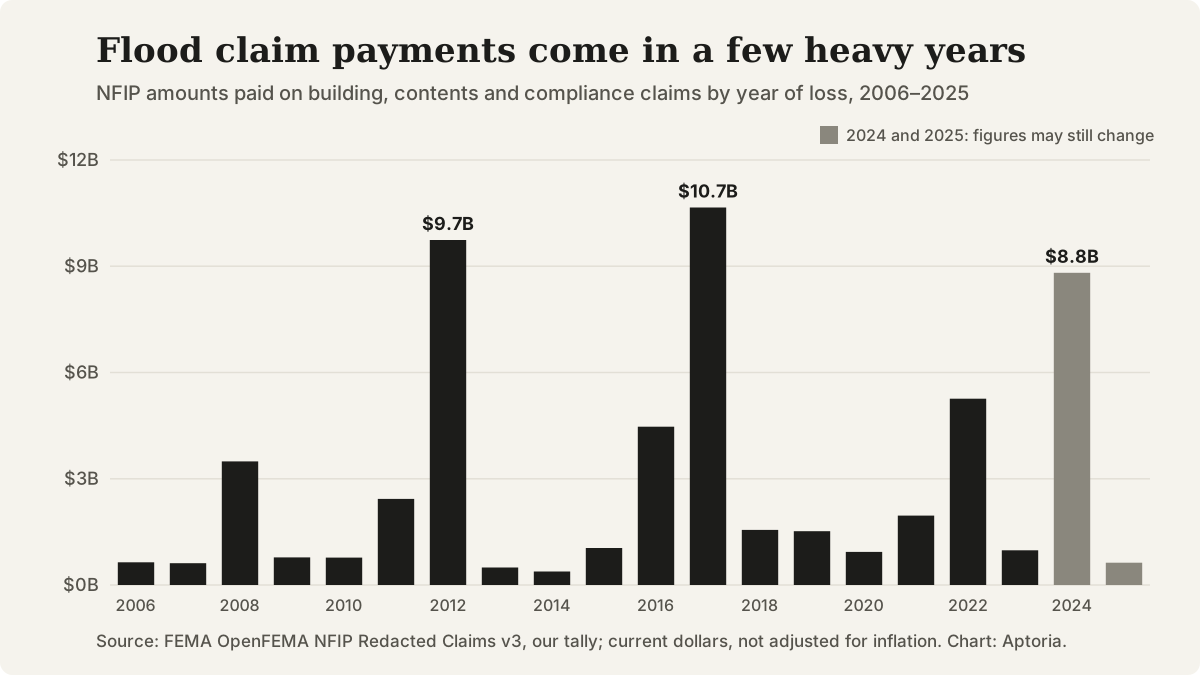
NFIP amounts paid by year of loss, 2006 to 2025, current dollars. Source: FEMA OpenFEMA NFIP Redacted Claims, our tally.
Questions that come up
Does this page include private flood insurance?
No. FEMA's penetration-rate data cover only National Flood Insurance Program policies, and FEMA says private flood insurance take-up is not available to it. The share of buildings with any flood coverage is higher than shown.
Why do so few homes outside high-risk zones have flood insurance?
The data show how many do, not why. Of the 3,161,236 residential NFIP contracts, 1.32 million are on buildings outside the Special Flood Hazard Area, about 1.2% of all residential buildings, our calculation. FEMA's data do not record owners' reasons for buying or not buying.
Does an NFIP policy cover a tenant's belongings?
Not a landlord's building policy. Under federal rules, building and contents coverage are separate, residential contents coverage is capped at $100,000, and contents limits are not per building, so a tenant can buy a contents policy for their own belongings.
Does this page tell me whether I must buy flood insurance?
No. Whether flood insurance is required depends on the property, its flood zone and the loan. A lender or a licensed insurance professional can say what applies to a specific building.
Sources and references
Follow each source to check the underlying claim. Access checks and professional review are different steps.