The short answer
Yes, though the pace is slowing. Average homeowners insurance premiums on mortgaged homes rose 62.2% from 2019 to 2024, according to a Dallas Fed analysis of ICE McDash data. ICE says costs rose 8.7% in the year to the second quarter of 2026, down from 15.1% at the end of 2024, to a record $209 a month.
Key takeaways
The key numbers
These national figures come from Federal Reserve and Treasury research and from ICE's own mortgage data. They describe homeowners insurance on owner-occupied and mortgaged homes, which is a different product from a landlord policy, so read them as a guide to the direction of the market rather than a quote for your building.
| Measure | Figure | Period | Source |
|---|---|---|---|
| Average monthly property insurance payment, single-family mortgage holders | $209 a month | Q2 2026 | ICE (its own data) |
| Change in that payment over the past year | +8.7% | Year to Q2 2026 | ICE (its own data) |
| Change in average homeowners premium, mortgaged homes | +62.2% | 2019 to 2024 | Dallas Fed (ICE McDash data) |
| Change in overall consumer prices (CPI, annual average) | +22.7% | 2019 to 2024 | BLS |
| CPI tenants' and household insurance index | +4.9% | 2019 to 2024 | Dallas Fed (BLS data) |
| Average homeowners premium, mortgaged homes | About $2,300 a year | 2024 | Dallas Fed (ICE McDash data) |
| Premiums per policy relative to inflation | 8.7% faster | 2018 to 2022 | Treasury Federal Insurance Office |
How much have insurance premiums risen?
A lot since 2019. Dallas Fed researchers, using ICE McDash data on insurance payments for homes with a mortgage (about two-thirds of the mortgage market), find average premiums rose 62.2% from 2019 to 2024. Overall consumer prices rose 22.7% over the same years, comparing annual averages of the CPI. Because these are payments, they also reflect changes in how much coverage owners carry, not only changes in price. In the six years before 2019, the premium index rose 15.4%.
The annual increases grew from +3.9% in 2020 to +11.6% in 2022 and +13.9% in 2023, then +13.8% in 2024. The researchers estimate the average 2024 premium at about $2,300, about 2.7% of median household income compared with about 2% before the pandemic. The note does not say which income measure it uses.
ICE's own data are more recent. ICE says the average single-family mortgage holder paid a record $209 a month for property insurance in the second quarter of 2026, nearly 80% more than at the start of 2020 and 9.6% of the average monthly mortgage payment.
A Treasury study of 2018 to 2022 reached a similar conclusion for that period: across the country, average premiums per policy grew 8.7% more than inflation.
| Year | Change from prior year |
|---|---|
| 2020 | +3.9% |
| 2021 | +7.9% |
| 2022 | +11.6% |
| 2023 | +13.9% |
| 2024 | +13.8% |
Are increases slowing down?
Yes, according to ICE. It says annual growth in property insurance costs peaked at 15.1% at the end of 2024, was 11.4% at the start of 2026 and 8.7% in the second quarter. The 1.8% rise from the first quarter was the smallest quarterly gain since ICE started tracking the measure.
ICE attributes about two-thirds of the past year's increase to higher coverage limits, up 5.5%, with the cost per $1,000 of coverage up 3%. Slower growth still means costs are higher than a year ago.
ICE's 15.1% peak and the Dallas Fed's +13.8% for 2024 are different measures: ICE tracks growth in its own payment measure over the year to the end of 2024, while the Dallas Fed series compares calendar years.
The Dallas Fed authors, writing in April 2026, also expected premium growth to ease through the end of 2026, citing a recovery in insurers' profits and falling reinsurance rates. That is their outlook. This page does not forecast insurance prices.
Why don't inflation measures show the increase?
They are built to measure something else. The Dallas Fed explains that the CPI's tenants' and household insurance index is priced from renters insurance, which mostly protects belongings rather than the building. That index rose only 4.9% from 2019 to 2024.
The PCE measure, net household insurance, subtracts insurers' expected payouts from premiums. It rose 34.7% over the same years, while the PCE premium series rose 63.9% and insurer losses rose 105.9%. A budget that inflates insurance by a general inflation rate would have fallen well short.
Where have premiums risen most?
They rose in every state in the Dallas Fed's data, by very different amounts. Across the 48 states and D.C. in the data, the median increase from 2019 to 2024 was 52.6%. Premiums rose more than 50% in 31 of them and more than 75% in 8. Alaska and Hawaii are not in the data.
The Treasury study looked at ZIP codes from 2018 to 2022. In the fifth of ZIP codes with the largest increases, premiums per policy outpaced inflation by at least 14.7%, while in the fifth with the smallest, premiums lagged inflation by at least 1.4%. In the fifth of ZIP codes with the highest expected losses from climate-related perils, homeowners paid an average inflation-adjusted premium of $2,321 a year over 2018 to 2022, 82% more than in the lowest-risk fifth.
| State | Change in average premium |
|---|---|
| Utah | +90.3% |
| Idaho | +83.9% |
| Arizona | +81.2% |
| Colorado | +78.5% |
| Florida | +78.3% |
| New Jersey | +40.9% |
| Maine | +39.5% |
| Michigan | +38.0% |
| District of Columbia | +34.7% |
| West Virginia | +29.9% |
Why are premiums rising?
The researchers point to several causes. The Dallas Fed authors cite higher rebuilding costs during the pandemic and insured losses from natural disasters that have risen over the past decade. They also say U.S. reinsurance rates rose 107% from 2019 to 2024, without naming a source for that figure, and note that premiums were already rising before the pandemic.
The Treasury study found that areas with higher expected losses from climate-related perils had higher premiums, higher claim costs and more nonrenewals. These are the researchers' explanations; this page does not test them.
Is insurance getting harder to get?
For some owners, yes. The Treasury study found nonrenewal rates rose in 2022, and were higher in the highest-risk ZIP codes.
In the Federal Reserve Board's Survey of Household Economics and Decisionmaking (SHED) for 2025, 6% of homeowners had no insurance on their home. Among owners without a mortgage, the share was 13%. Of the uninsured, 43% said they couldn't afford coverage. Among insured homeowners, 20% wanted more coverage but couldn't afford it, and more than 6 in 10 said costs had risen more than they expected. The survey covers people's own homes, not rental properties.
Do landlords pass insurance costs on to tenants?
Partly, for large apartment buildings, according to a Federal Reserve Board study. Hughes and Molloy looked at apartment buildings financed with CMBS-securitized mortgages and found real property insurance costs rose from $39 a month per unit in 2019 to $68 in 2024, an increase of more than 75%.
Each added dollar of insurance cost was associated with 25 to 40 cents of added revenue, which the authors read as landlords offsetting about one third of the increase. They translate that into roughly $7 to $12 a month in rent for the average tenant, while owners' net income fell by about 72 cents per added dollar. These are associations, not proof of cause.
The buildings in the study tend to be larger, newer and higher quality than the typical apartment building, so small landlords may face different conditions. Where rent regulation applies, it can limit how much of a cost increase is reflected in rent.
What this means for landlords
These are considerations to weigh against your own policies and market. They are not insurance, legal or financial advice.
- The figures on this page are for homeowners insurance. Landlord or dwelling policies are separate products, so your own renewal quote is the number that counts.
- Starting the renewal conversation early leaves time to compare quotes if your premium jumps or your policy is not renewed.
- ICE reports that homeowners who switched carriers over the past year cut their insurance payments by 6.6% on average, while those who stayed saw a 10.4% increase. Those are ICE's figures for homeowners, but they suggest comparing quotes can matter.
- Comparing quotes at different deductibles shows how much cost moves between the premium and what you would pay on a claim, which depends on your reserves.
- Average premium payments rose 62.2% from 2019 to 2024 while overall consumer prices rose 22.7%. Payments also reflect coverage changes, but a budget that grows insurance at the general inflation rate may still come up short.
- The Treasury report notes that state insurance regulators are the primary regulators of insurance in the United States, so your state's regulator is a starting point for local information.
- If your leases require tenants to carry renters insurance, keep in mind that renters policies mostly protect tenants' belongings, as the Dallas Fed notes, not the building.
What changed in this update
First published 2026-10-24. Future updates will add newer premium data as it is published and list what changed.
Methodology
We fetch each source with a script and compute every change from the published data. The 2013 to 2024 premium path and the state figures come from the Dallas Fed's chart-data workbook. Figures quoted from the Dallas Fed note, ICE's release, the Federal Reserve Board survey and study, and the Treasury report are checked against the fetched text before the page is built.
The CPI comparison uses annual averages of the all-items index for 2019 and 2024. The state median is the middle value of the 49 published state and D.C. changes, not a premium-weighted national figure. The Treasury figures are the report's own national findings; we did not recompute them from its ZIP-level workbook.
Limitations
Read the figures with these limits in mind.
- The Dallas Fed premium series ends in 2024. The 2026 figures are ICE's own reported results, which we cannot check against the underlying loan data.
- ICE measures insurance payments by single-family mortgage holders, which change with coverage amounts as well as prices, so its growth rates are not directly comparable to price indexes.
- ICE McDash data cover homes with a mortgage only.
- Homeowners policies differ from landlord or dwelling policies, and from coverage on multifamily buildings.
- Alaska and Hawaii are not in the Dallas Fed's state data.
- The Treasury study covers 2018 to 2022 and excludes flood, which it says private homeowners insurance generally does not cover.
- The apartment-building study covers larger CMBS-financed properties and reports associations, not causal effects.
- The SHED asks about people's own homes, not properties they rent out.
- This page does not yet include the Bureau of Labor Statistics producer price indexes for insurance premiums.
- Research notes reflect their authors' views, not those of the Federal Reserve System or Treasury.
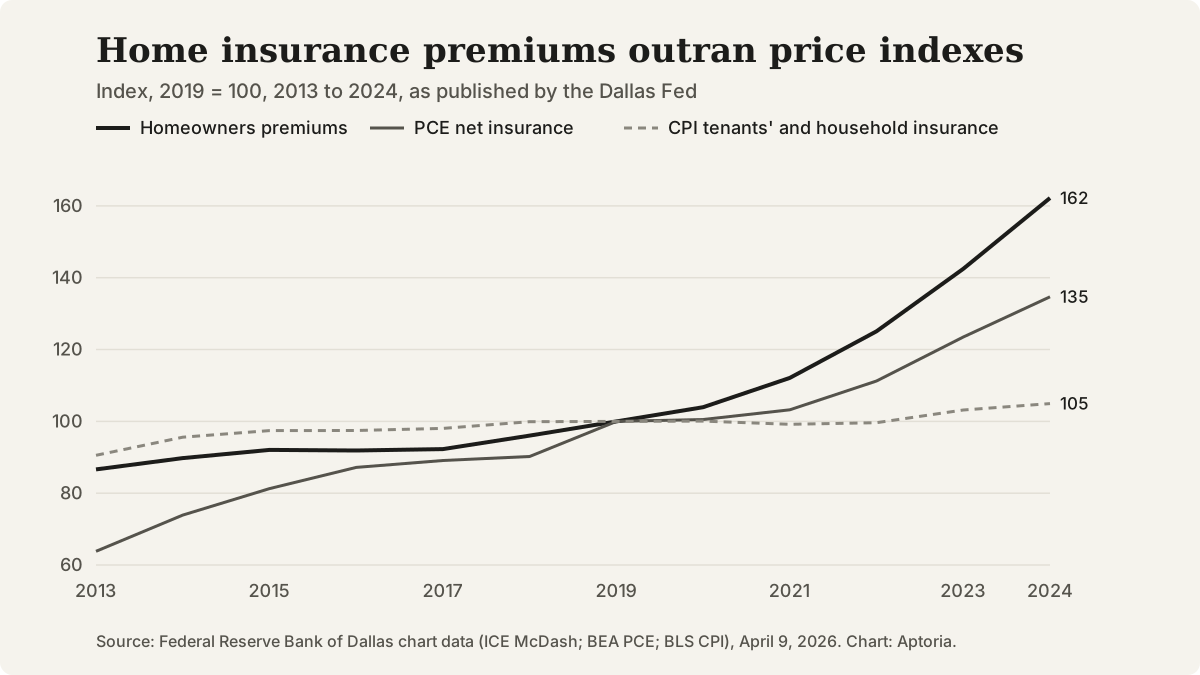
Homeowners insurance premiums for mortgaged homes (ICE McDash) vs PCE net household insurance and CPI tenants' and household insurance, 2013 to 2024, indexed to 2019. Source: Federal Reserve Bank of Dallas chart data.
Questions that come up
Do these figures apply to landlord insurance?
Not directly. They measure homeowners insurance, and the Dallas Fed and ICE figures cover homes with a mortgage. Policies for rental properties are separate products, so use these figures as a sign of market direction and compare your own quotes.
Does this include flood insurance?
The Treasury study does not: it leaves out flood because, as it notes, private homeowners insurance generally excludes flood losses. The Dallas Fed note and ICE's release do not say whether their figures include flood coverage.
What does the CPI insurance index measure?
The Dallas Fed explains that it is priced from renters insurance, which mostly protects belongings. That is why it rose only 4.9% from 2019 to 2024 while homeowners premiums rose much more.
How often is this page updated?
We plan to update it when new national premium data are published. The updated date at the top shows when the figures last changed.
Sources and references
Follow each source to check the underlying claim. Access checks and professional review are different steps.