The short answer
Much of U.S. rental housing is decades old. In 2024, renter-occupied homes had a median year built of 1981, and 48.7% were built before 1980, Census data show. Older rentals report more problems: in 2023, 19.4% of rental units in buildings from before 1960 had signs of mice or rats, against 4.2% in buildings from 2000 or later.
Key takeaways
The key numbers
The American Community Survey counted 46.1 million renter-occupied homes in 2024. Half were in buildings put up before 1981 and half after, about the same as for owner-occupied homes (1982).
Condition data come from the 2023 American Housing Survey, which asks households about leaks, pests, heating and other problems. On most of its measures renter-occupied homes report problems more often than owner-occupied homes.
* Among households that lived in the home last winter and had heating equipment.
| Measure | Renter-occupied | Owner-occupied | Source |
|---|---|---|---|
| Median year structure built | 1981 (±1) | 1982 (±1) | ACS 2024 |
| Built before 1980 | 48.7% | 47.1% | ACS 2024 |
| Built in 1939 or earlier | 12.1% | 10.6% | ACS 2024 |
| Moderately or severely inadequate (HUD measure) | 7.7% (±0.5) | 3.3% (±0.2) | AHS 2023 |
| Any water leak, inside or from outside, last 12 months | 16.3% (±0.6) | 14.9% (±0.4) | AHS 2023 |
| Signs of cockroaches, last 12 months | 17.9% (±0.7) | 8.5% (±0.5) | AHS 2023 |
| Uncomfortably cold 24+ hours because heating broke down, last winter* | 4.1% (±0.3) | 2.0% (±0.2) | AHS 2023 |
How old are America's rental homes?
The median renter-occupied home in 2024 was in a building built in 1981, so the typical rental was about 43 years old. The largest single decade was the 1970s, at 14.6% of renter-occupied units, and 12.1% were in buildings from 1939 or earlier.
Newer stock is a smaller share: 15.8% of renter-occupied homes were built in 2010 or later, including 3.9% from 2020 on. Renters are somewhat more likely than owners to live in the oldest buildings (12.1% vs 10.6% built in 1939 or earlier).
Year built is the household's estimate of when the building was first constructed, not when it was last renovated. A 1960s building with a new roof and rewired units still counts as built in the 1960s.
What condition are rental homes in?
Most rental homes pass HUD's housing adequacy measure, but problems are common enough to plan for. In 2023, 2.1% of the 46.4 million renter-occupied units were rated severely inadequate and 5.6% moderately inadequate, against 0.8% and 2.5% of owner-occupied homes.
Smaller problems are more widespread. 10.5% of renter-occupied units had a water leak from inside the building in the previous 12 months and 17.9% had signs of cockroaches, compared with 7.3% and 8.5% of owner-occupied homes. Among renter households that lived in the home last winter and had heating equipment, 4.1% were uncomfortably cold for 24 hours or more because the heating equipment broke down.
Two measures run the other way: owner-occupied homes more often reported leaks from outside (9.2% vs 8.0%) and signs of mice or rats (12.3% vs 11.0%). The survey does not say why. These are household reports, not inspections.
* Among households that lived in the home last winter and had heating equipment. ** Among homes with hot and cold piped water.
| Condition | Renter-occupied | Owner-occupied |
|---|---|---|
| Severely inadequate | 2.1% (±0.3) | 0.8% (±0.1) |
| Moderately inadequate | 5.6% (±0.4) | 2.5% (±0.2) |
| Water leak from inside (pipes, fixtures, water heater) | 10.5% (±0.5) | 7.3% (±0.3) |
| Water leak from outside (roof, basement, walls, windows) | 8.0% (±0.5) | 9.2% (±0.4) |
| Signs of cockroaches | 17.9% (±0.7) | 8.5% (±0.5) |
| Signs of mice or rats | 11.0% (±0.5) | 12.3% (±0.5) |
| Open cracks or holes in interior walls or ceilings | 7.0% (±0.4) | 4.5% (±0.3) |
| Broken plaster or peeling paint, area larger than 8 by 11 inches (interior) | 3.4% (±0.3) | 1.5% (±0.2) |
| Holes in floors | 2.0% (±0.2) | 1.0% (±0.1) |
| Water supply stopped in last 3 months** | 5.0% (±0.3) | 2.7% (±0.2) |
| Uncomfortably cold 24+ hours, any cause* | 10.3% (±0.5) | 6.6% (±0.3) |
| Uncomfortably cold 24+ hours because heating broke down* | 4.1% (±0.3) | 2.0% (±0.2) |
Do older rental buildings have more problems?
Comparing the oldest and newest groups, yes, on every measure in the table below. Renter-occupied units in buildings from before 1960 were more likely than units in buildings from 2000 or later to have signs of mice or rats (19.4% vs 4.2%), any water leak (19.7% vs 11.2%) and a moderately or severely inadequate rating (11.3% vs 5.1%). Each of those gaps is statistically significant at 90% confidence.
Signs of mice or rats, inadequate ratings, wall cracks and heating breakdowns were lower in each newer age group, and each step is statistically significant, though some only narrowly. Cockroach reports were similar in buildings from before 1960 through the 1990s and lower only in buildings from 2000 or later, and any-leak rates in the 1960 to 1979 and 1980 to 1999 groups were not statistically different.
Building age is only one difference between these groups. Older buildings also differ in size, location, upkeep and who lives in them, and the survey cannot separate those effects, so these figures describe what renters report rather than what building age causes.
| Condition | Built before 1960 | 1960 to 1979 | 1980 to 1999 | 2000 or later |
|---|---|---|---|---|
| Signs of mice or rats | 19.4% (±1.3) | 11.2% (±1.0) | 7.8% (±0.8) | 4.2% (±0.7) |
| Any water leak | 19.7% (±1.2) | 17.4% (±1.3) | 16.4% (±1.0) | 11.2% (±1.2) |
| Moderately or severely inadequate | 11.3% (±1.0) | 7.8% (±0.8) | 6.2% (±0.7) | 5.1% (±0.8) |
| Open cracks or holes in walls or ceilings | 10.2% (±1.0) | 7.7% (±0.8) | 6.2% (±0.9) | 3.5% (±0.7) |
| Signs of cockroaches | 19.1% (±1.1) | 19.6% (±1.4) | 18.7% (±1.2) | 13.9% (±1.2) |
| Cold 24+ hours because heating broke down* | 6.0% (±0.8) | 4.4% (±0.6) | 3.1% (±0.5) | 2.3% (±0.6) |
| Renter-occupied units (millions) | 12.7 | 11.8 | 11.0 | 10.9 |
Does building size matter?
Somewhat, and the pattern depends on the problem. Of renter-occupied units in 2023, 34.8% were single-family homes, 16.5% were in buildings with 2 to 4 units, 44.5% were in buildings with 5 or more and 4.2% were manufactured or mobile homes or other types.
Signs of mice or rats were more common in rented single-family homes (12.9%) and 2 to 4 unit buildings (11.9%) than in buildings with 5 or more units (8.5%). Cockroaches ran the other way, at 21.6% in larger buildings against 13.9% in single-family rentals.
Units in 2 to 4 unit buildings reported any water leak more often (18.8%) than single-family rentals (15.3%) or larger buildings (16.2%). The share rated inadequate in 2 to 4 unit buildings (7.7%) was not statistically different from larger buildings (8.7%).
Where is the rental stock oldest and newest?
In the Northeast. New York's renter-occupied homes had the oldest median year built of any state in 2024 (1959), and 72.5% were built before 1980. Rhode Island, Massachusetts, Pennsylvania and Connecticut followed, with medians from 1964 to 1969.
The newest rental stock was in Utah (1996), Nevada (1995), North Dakota and Texas (1994) and Idaho (1993). Medians a year or two apart may not differ significantly once margins of error are counted, so treat close rankings as ties.
| State | Renter median year built | Renter units built before 1980 | Owner median year built |
|---|---|---|---|
| New York | 1959 (±1) | 72.5% | 1960 (±2) |
| Rhode Island | 1964 (±3) | 72.1% | 1965 (±2) |
| Massachusetts | 1965 (±1) | 67.3% | 1965 (±1) |
| Pennsylvania | 1966 (±1) | 68.5% | 1966 (±1) |
| Connecticut | 1969 (±1) | 66.1% | 1967 (±1) |
| Utah | 1996 (±2) | 31.8% | 1994 (±1) |
| Nevada | 1995 (±1) | 23.4% | 1999 (±1) |
| North Dakota | 1994 (±3) | 34.0% | 1980 (±1) |
| Texas | 1994 (±1) | 29.6% | 1996 (±2) |
| Idaho | 1993 (±2) | 35.9% | 1994 (±1) |
What this means for landlords
These are considerations to weigh against your own buildings, not recommendations.
- Building age is one input to a capital reserve. Unless they have been replaced, roofs, plumbing and heating systems in older buildings may have had longer to wear, and in the survey older rental buildings reported more leaks, rodents and heating breakdowns. A reserve built from the actual age of each system tells you more than the building's year alone.
- Inspection timing can follow the problems renters report most. 10.5% of renter-occupied units had a leak from inside the building in a year and 4.1% of renter households that lived in their home last winter went cold for a day or more after a heating breakdown, so checks of plumbing, water heaters and heating equipment before winter and at turnover are worth considering.
- Pest risk differs by building type: rodent signs were reported more often in single-family rentals and 2 to 4 unit buildings, cockroaches more often in buildings with 5 or more units.
- If a rental was built before 1978, the federal lead-based paint disclosure rule, issued jointly by EPA and HUD, generally requires landlords, before a lease is signed, to disclose known lead-based paint and lead hazards, share any available lead records or reports, give tenants an EPA-approved pamphlet and include a lead warning statement in or attached to the lease. The rule has exceptions, including zero-bedroom units such as studios, housing for older people or people with disabilities, and leases of 100 days or less with no renewal or extension. A child under 6 living or expected to live in the home can remove the first two exceptions: HUD's version of the rule applies that condition to housing for older people or people with disabilities, and EPA's version and guidance page also apply it to zero-bedroom units. Census's year-built groups do not split at 1978, so the figures here cannot show how many rentals the rule covers.
- Repair duties and habitability standards vary by state and locality. Check the rules where your property is.
- Costs matter too. Our repair-costs page tracks what construction materials and labor cost now.
Methodology
Age figures come from the Census Bureau's 2024 American Community Survey 1-year estimates, tables B25036 and B25037, for the United States and the 50 states plus the District of Columbia. Medians and their margins of error are Census's published values. Shares by decade are our calculations from B25036, with margins of error approximated from the published cell margins using Census's formulas; for states the margin on the share built before 1980 ranges from about 0.5 to 3.8 percentage points.
Condition figures are our tabulations of the 2023 American Housing Survey national public use file. The AHS is sponsored by HUD and conducted by the Census Bureau. We count occupied homes, with renter-occupied meaning rented for cash or occupied without payment of rent, as in the AHS definitions. Margins of error use the file's 160 replicate weights and Census's replicate-variance formula, at 90% confidence; differences we describe are significant at that level.
To check the tabulations, we matched 31 all-occupied-unit counts against the estimates in Census's 2023 table-specification workbook, and our margins of error matched the published ones. The public use file groups 1980–2009 construction years into decades, so we do not compute an AHS median year built; Census's table-specification workbook (Table Creator estimates) puts the median for all occupied homes at 1979 (±2).
For the water-supply item, homes whose answer was not reported stay in the denominator, as in Census's tables. Adjacent age-group steps are tested with the same replicate method; the 1980 to 1999 vs 2000 or later steps for inadequacy and heating breakdowns clear the 90% threshold only narrowly (differences of 1.14 and 0.89 percentage points against margins of 1.06 and about 0.8).
The two surveys differ in sample and year, and so do their figures: the AHS puts 52.8% of renter-occupied homes before 1980 in 2023, against 48.7% in the 2024 ACS. We use the ACS for age and geography and the AHS for condition. All values are rounded once from unrounded data.
We plan to refresh the age figures after Census releases 2025 ACS 1-year data, scheduled for October 29, 2026, and the condition figures when Census publishes new American Housing Survey data.
Source: U.S. Census BureauSource: U.S. Census BureauSource: U.S. Census BureauSource: U.S. Census Bureau and U.S. Department of Housing and Urban DevelopmentSource: U.S. Census BureauSource: U.S. Department of Housing and Urban Development and U.S. Census BureauSource: U.S. Census BureauSource: U.S. Census BureauSource: U.S. Census BureauSource: U.S. Census Bureau
Limitations
Keep these limits in mind.
- Both surveys rely on what households report. Census notes that year built is more prone to response errors than many other questions, because respondents often estimate it.
- AHS condition items are household reports covering the past 3 or 12 months or last winter, or describing the home at the time of the interview (cracks, holes, peeling paint), depending on the item. They are not inspections.
- Housing adequacy is HUD's composite measure with specific thresholds, such as being uncomfortably cold for 24 hours or more last winter because the heating broke down at least three times for six hours or more each; it is not a legal habitability standard.
- The AHS figures are national. They do not show conditions in a particular state, city or building.
- The AHS covers 2023 and the ACS covers 2024, so the two sets of figures are about a year apart.
- Some differences between neighboring building-age groups are only narrowly significant, notably for inadequacy and heating breakdowns between buildings from 1980 to 1999 and those from 2000 or later.
- This page does not forecast repair needs or costs for any property.
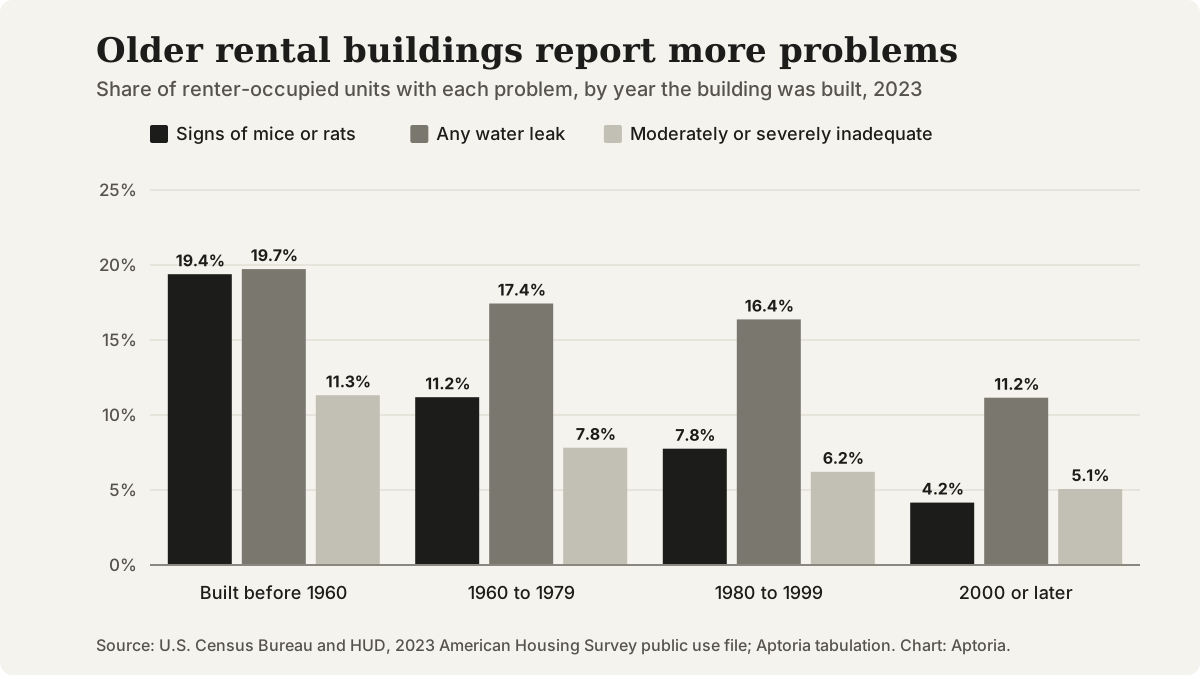
Share of renter-occupied units with signs of mice or rats, any water leak, or a moderately or severely inadequate rating, by year built, 2023. Source: American Housing Survey public use file; Aptoria tabulation.
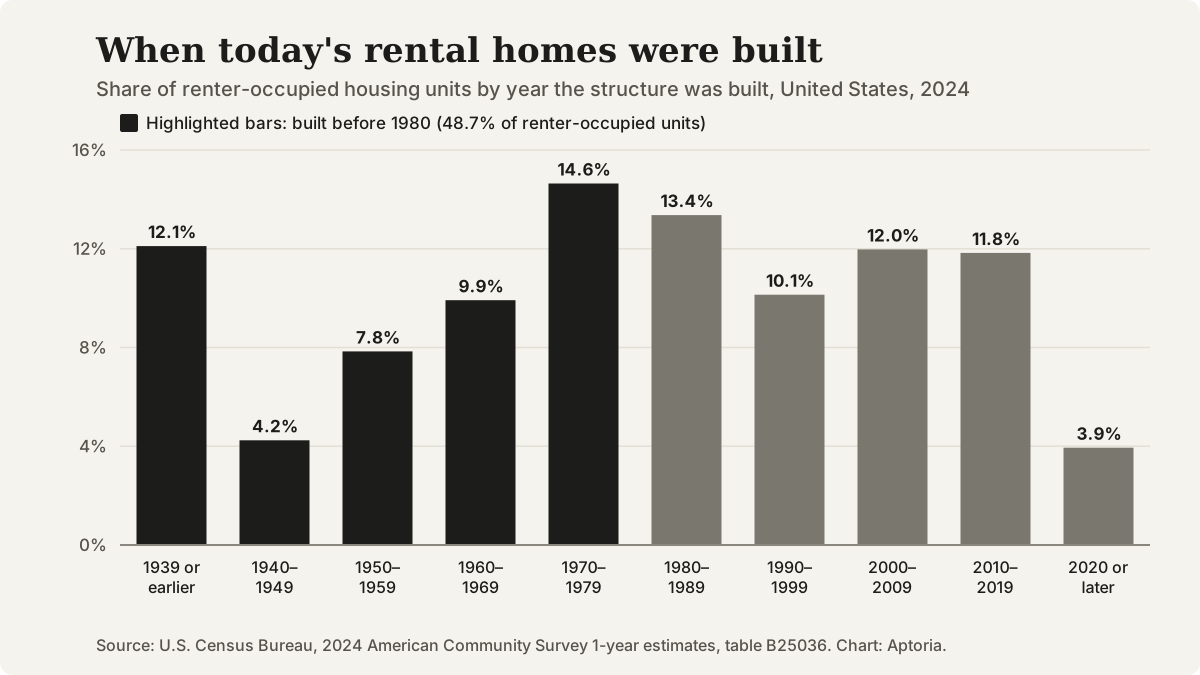
Share of U.S. renter-occupied housing units by decade the structure was built, 2024. Source: Census Bureau, American Community Survey 1-year estimates, table B25036.
Questions that come up
How old is the typical rental home in the U.S.?
In 2024, renter-occupied homes had a median year built of 1981, per the American Community Survey, which made the typical rental about 43 years old. Census reports a median rather than an average for year built.
What does "inadequate" housing mean in the American Housing Survey?
It is HUD's housing adequacy measure. A home is severely inadequate if it has a serious plumbing, heating, electrical or upkeep problem, such as lacking hot or cold piped water or having five of six listed maintenance problems. Moderately inadequate covers less severe cases, such as three or four of those problems.
Are rental homes in worse condition than owner-occupied homes?
On most survey measures, yes: renter-occupied homes more often reported inadequacy, interior leaks, cockroaches and heating breakdowns in 2023. Owner-occupied homes more often reported leaks from outside and signs of mice or rats.
Where can I find this data for my area?
The American Community Survey publishes year built by tenure for states, metro areas, counties and cities on data.census.gov. The American Housing Survey publishes detailed condition data for the nation and selected large metro areas through its Table Creator.
Sources and references
Follow each source to check the underlying claim. Access checks and professional review are different steps.