The short answer
Homeowners spent $383.8 billion on improvements in 2025, per Census construction data that leave out rental properties. In the 2023 American Housing Survey, the median roof job cost owners $10,000, a kitchen remodel $8,000 and heating or central air work $5,500. Rental owners reported a median of $1,575 per unit for maintenance and repairs in 2023.
Key takeaways
The key numbers
Three Census surveys measure this from different angles: a national total for owner-occupied homes, what homeowners say individual jobs cost, and what rental owners report spending per unit. None is a complete count of every dollar spent on every kind of housing.
Margins of error are at 90% confidence. The construction-spending figure has a coefficient of variation of 3.7%, per Census.
| Measure | Value | Source |
|---|---|---|
| Improvements to owner-occupied homes, 2025 | $383.8 billion | Census construction spending |
| Same measure, 2015 | $148.5 billion | Census construction spending |
| Owner-occupied homes with at least one improvement job in the past two years, 2023 | 59.4% (±0.7) | AHS 2023, our tabulation |
| Median cost of a roof job, homeowners | $10,000 (±$661) | AHS 2023, Census estimate |
| Share of homeowner jobs done mostly by the household | 35.9% (±0.7) | AHS 2023, our tabulation |
| Rental properties: median maintenance and repair cost per unit, 2023 | $1,575 (±$449) | RHFS 2024, Census estimate |
| Rental properties: median capital improvement spending per unit, 2023 | $650 (±$584) | RHFS 2024, Census estimate |
Source: U.S. Census BureauSource: U.S. Census BureauSource: U.S. Census Bureau and U.S. Department of Housing and Urban DevelopmentSource: U.S. Census Bureau and U.S. Department of Housing and Urban DevelopmentSource: U.S. Census Bureau and U.S. Department of Housing and Urban DevelopmentSource: U.S. Census Bureau and U.S. Department of Housing and Urban Development
How much do homeowners spend on improvements each year?
Census estimates that private spending on improvements to owner-occupied homes reached $383.8 billion in 2025, up from $371.2 billion in 2024 and $148.5 billion in 2015. The 2025 figure is about 2.6 times the 2015 level in current dollars, not adjusted for inflation. Spending dipped in 2023 ($330.7 billion) before rising again.
Census puts the standard error of the 3.4% rise from 2024 to 2025 at 7.5 percentage points, so by Census's 90% standard the change is not significant. Improvements made up 41.6% of private residential construction spending in 2025, with the rest going to new single-family and multifamily buildings.
For 2026 so far, our sum of Census's monthly estimates gives $247.6 billion for January to August, 3.9% below the same months of 2025 ($257.7 billion). Census warns that its preliminary monthly improvement estimates rely on forecasts and are subject to large revisions, so treat that comparison as provisional. September 2026 data are scheduled for November 2, 2026.
This series counts remodeling, additions and major replacements such as furnaces, water heaters and central air. It leaves out maintenance and repairs, and it leaves out rental, vacant and seasonal properties entirely. It is a measure of owner-occupant spending, not landlord spending.
What do common improvement jobs cost?
The 2023 American Housing Survey asked homeowners about major jobs done in roughly the two years before the interview. 59.4% of owner-occupied homes (51.55 million) reported at least one, for about 139.9 million jobs in all. The median job cost $2,000 and the mean $6,181, per Census's estimates.
Roofs had the highest median of the jobs shown, at $10,000. Kitchen remodels came next at $8,000, then heating or central air at $5,500. Costs cover the entire job, including amounts paid by insurance, but not the household's own time.
Households did 35.9% of all jobs mostly themselves, by our tabulation. That share was much lower for roofs (14.2%) and heating or central air (12.5%) than for plumbing fixtures (47.4%). Do-it-yourself costs exclude the household's own labor, and for most job types the median for jobs the household did not do itself was higher, as the table shows.
* Hired out means no household member did most of the work, per the survey question; it does not necessarily mean the work was paid for. Hired-out medians are our tabulation of the public use file, which rounds and caps reported costs. Reported costs cluster at round amounts, so we do not show margins for these medians.
| Job | Jobs | Median cost, all jobs (Census) | Median cost, hired out* | Done mostly by the household |
|---|---|---|---|---|
| Roof | 8.3 million | $10,000 (±$661) | $10,000 | 14.2% (±1.4) |
| Kitchen remodel | 5.0 million | $8,000 (±$1,019) | $12,000 | 41.4% (±2.7) |
| Heating or central air (HVAC) | 12.8 million | $5,500 (±$234) | $6,000 | 12.5% (±1.2) |
| Bathroom remodel | 7.5 million | $5,000 (±$113) | $8,000 | 42.5% (±2.0) |
| Siding | 2.3 million | $5,000 (±$253) | $6,900 | 27.7% (±3.0) |
| Flooring, carpet, paneling or ceilings | 10.9 million | $3,000 (±$119) | $4,000 | 37.8% (±1.5) |
| Windows or doors | 7.9 million | $2,800 (±$430) | $4,200 | 31.5% (±1.9) |
| Insulation | 3.1 million | $1,500 (±$385) | $2,500 | 42.8% (±3.2) |
| Water pipes | 3.6 million | $1,000 (±$111) | $1,800 | 36.0% (±2.6) |
| Electrical wiring, fuse boxes or breakers | 6.6 million | $1,000 (±$38) | $1,500 | 31.4% (±2.0) |
| Water heater, dishwasher or disposal | 16.4 million | $800 (±$17) | $1,000 | 41.1% (±1.3) |
| Plumbing fixtures | 9.9 million | $542 (±$92) | $990 | 47.4% (±1.6) |
Source: U.S. Census Bureau and U.S. Department of Housing and Urban DevelopmentSource: U.S. Census Bureau and U.S. Department of Housing and Urban DevelopmentSource: U.S. Census Bureau and U.S. Department of Housing and Urban DevelopmentSource: U.S. Census Bureau and U.S. Department of Housing and Urban DevelopmentSource: U.S. Census Bureau
What do rental owners spend on repairs and improvements?
The 2024 Rental Housing Finance Survey asked owners and managers of 19.0 million rental properties (49.7 million units) about calendar 2023. Census's median for property maintenance cost, which corresponds to the survey's maintenance and repairs expense line, was $1,575 per unit (±$449), and the mean was $2,777 (±$528). Census does not say how these medians are weighted; its published distributions suggest they are taken across properties rather than units.
Capital improvement spending is harder to pin down. Census's median was $650 per unit, but with a margin of error of ±$584, and the mean was $4,952 (±$2,323). About 3.9 million properties (±1.3 million) reported no capital improvements that year, and the published distribution implies they are counted in the $650 median.
Many properties gave no answer. Census lists 43.1% of rental properties as not reported or not applicable for capital improvements, and 53.1% for maintenance and repair cost, so these figures describe the owners who answered.
The survey asked about repairs and capital work separately. Maintenance and repairs were one line of operating expenses, while capital improvements were defined as permanent structural additions or restorations that add value or extend useful life.
What this means for landlords
These are considerations for planning, not advice for any particular property.
- Use the homeowner job medians as a rough cross-check, not a quote. A roof job had a median of $10,000 and heating or central air $5,500, but rental jobs can differ in size, materials and contractor.
- Most roof and heating jobs were hired out, so the hired-out medians may be the closer comparison when you plan a reserve for those systems.
- Rental owners who answered the survey reported a median of $1,575 per unit for maintenance and repairs in 2023. Your own figure will depend on the age, size and condition of the building; see how old U.S. rental housing is and what condition renters report.
- The national figures are in current dollars. For how material and labor prices have moved, see the repair cost trends page.
- Whether a job counts as a repair or an improvement can matter for taxes. The glossary entry on repairs vs. improvements explains the terms; a tax professional can say how they apply to you.
- This page does not forecast spending or prices.
Methodology
National totals are Census's annual estimates of private residential improvements: 2015 to 2021 from privateha2.xlsx and 2022 to 2025 from private.xlsx. Each year matches the sum of Census's monthly not-seasonally-adjusted estimates (residential minus new single-family and new multifamily) within $3 million. The January to August comparisons are our sums of those monthly estimates; August 2026 is preliminary.
Homeowner job figures come from the 2023 American Housing Survey. Number of jobs, medians and means by job type are Census's Table Creator estimates and margins of error, as published in its table-specification workbook (table C-16-OO). Our tabulation of the public use file reproduces Census's counts of jobs (139.9 million) and of owner-occupied homes with at least one job (51.55 million).
Do-it-yourself shares and hired-out medians are our tabulations of the public use file, joining each job to its household's weights. Margins of error use the file's 160 replicate weights (Fay's method, variance = 4/160 times the sum of squared differences) at 90% confidence. Our all-jobs medians match Census's published medians within rounding before we split by who did the work.
Rental owner figures are Census's published 2024 Rental Housing Finance Survey tables on data.census.gov (Capital Improvements and Expenses, and Expenses), national totals for all rental properties, retrieved October 24, 2026.
Source: U.S. Census BureauSource: U.S. Census BureauSource: U.S. Census BureauSource: U.S. Census Bureau and U.S. Department of Housing and Urban DevelopmentSource: U.S. Census Bureau and U.S. Department of Housing and Urban DevelopmentSource: U.S. Census BureauSource: U.S. Census Bureau and U.S. Department of Housing and Urban DevelopmentSource: U.S. Census Bureau and U.S. Department of Housing and Urban Development
Limitations
Read these figures with their coverage in mind.
- The construction-spending series covers owner-occupied homes only and excludes maintenance and repairs. Census builds it from the Consumer Expenditure Survey, and recent months are revised, sometimes by a lot.
- The American Housing Survey asked its home improvement questions only of owners, so it says nothing directly about rental properties. Its two-year window and the national construction series measure different things, and the two should not be compared dollar for dollar.
- Homeowner costs are self-reported, include insurance-paid amounts and exclude the household's own labor. Job types are grouped; for example, water heaters are grouped with dishwashers and garbage disposals.
- The public use file rounds and caps job costs, so our hired-out medians are approximate. Reported costs cluster at round numbers, which is why we do not show margins for them.
- Rental survey figures have wide margins, and many properties did not report spending. Census also publishes these tables by property size (from single-unit properties to 50 or more units); this page uses the national totals for all rental properties, and the tables do not say exactly which properties the medians cover.
- Figures are in current dollars and are not adjusted for inflation.
Source: U.S. Census BureauSource: U.S. Census BureauSource: U.S. Census Bureau and U.S. Department of Housing and Urban DevelopmentSource: U.S. Census Bureau and U.S. Department of Housing and Urban DevelopmentSource: U.S. Census Bureau and U.S. Department of Housing and Urban DevelopmentSource: U.S. Census Bureau and U.S. Department of Housing and Urban DevelopmentSource: U.S. Census Bureau and U.S. Department of Housing and Urban Development
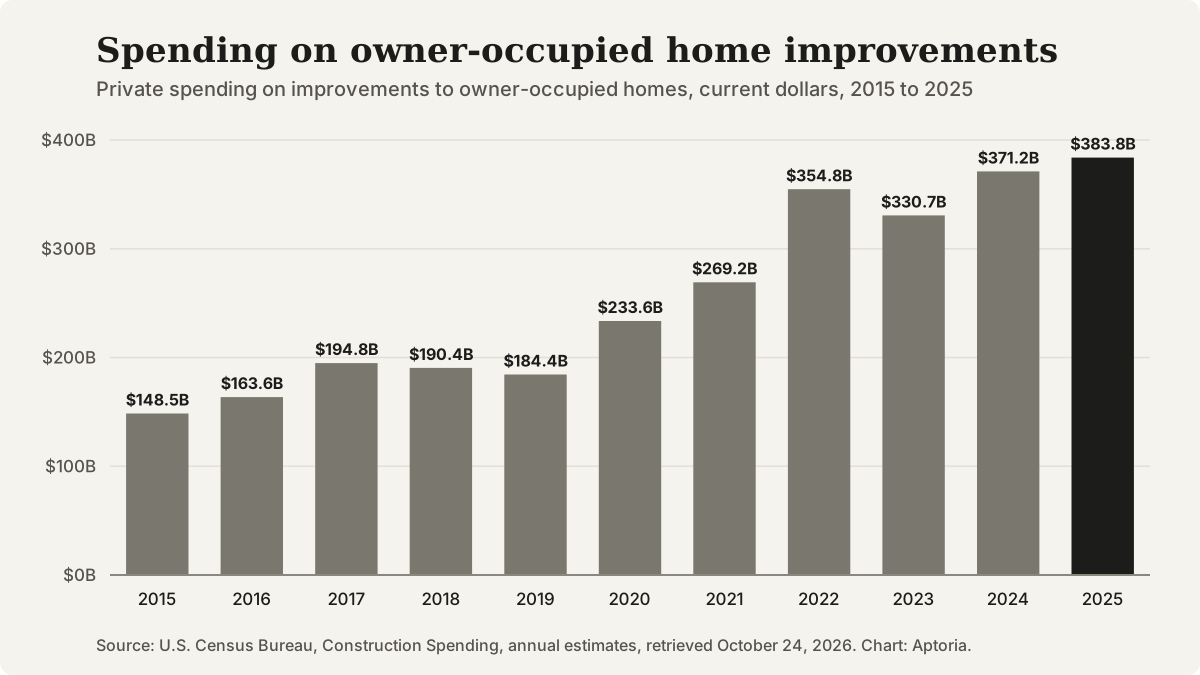
Private spending on improvements to owner-occupied homes, billions of current dollars, 2015 to 2025. Source: Census Bureau, Construction Spending.
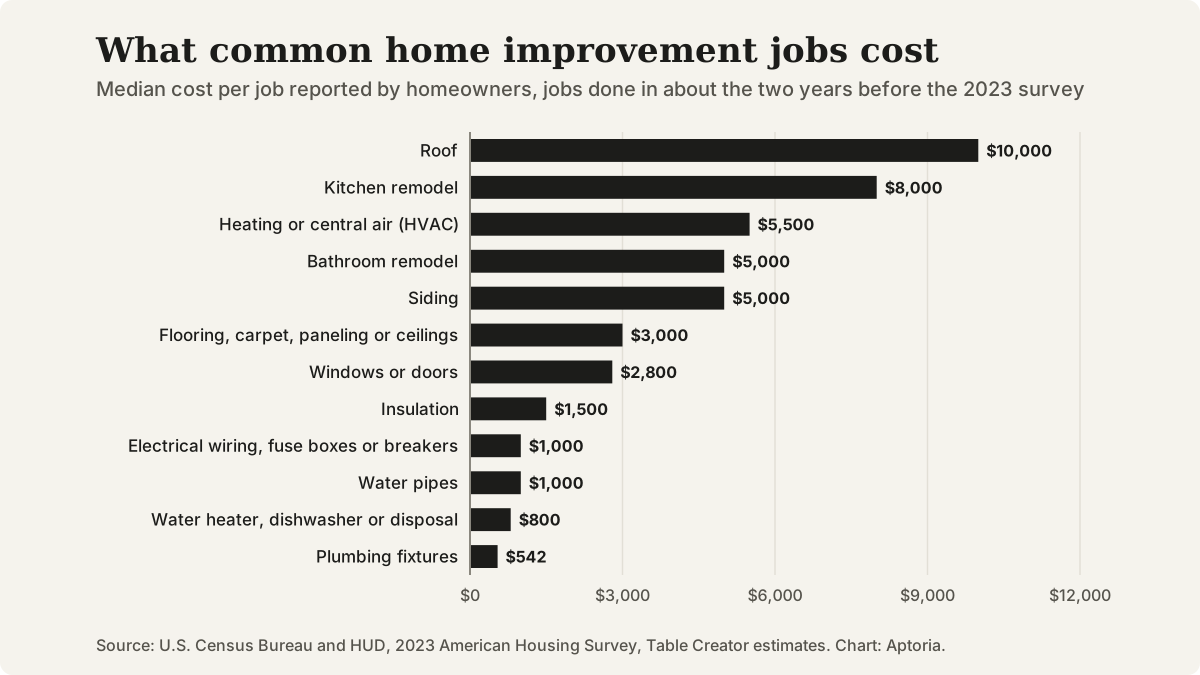
Median cost per job for common home improvement jobs reported by homeowners, 2023 American Housing Survey. Source: Census Table Creator estimates.
Questions that come up
Does this page include what landlords spend on rental properties?
Partly. Census's national construction-spending total excludes rental, vacant and seasonal properties, and the American Housing Survey's home improvement questions went only to owners. Rental spending comes from the 2024 Rental Housing Finance Survey, which reports per-unit medians and means for calendar 2023 with wide margins of error.
Is routine maintenance counted in the $383.8 billion?
No. Census defines improvements as remodeling, additions and major replacements to owner-occupied homes, such as a new furnace, water heater or central air system. Maintenance and repair work is excluded from the series.
Why are the hired-out medians usually higher than Census's medians?
Census's medians include jobs households did mostly themselves, and the survey asks households not to count their own time. Leaving those out leaves jobs that no household member mostly did, and for most job types those had higher medians. Our hired-out medians come from the public use file, which rounds and caps costs.
When will these figures be updated?
Census publishes construction spending monthly; September 2026 data are scheduled for November 2, 2026, and annual figures are revised each year. The American Housing Survey and the Rental Housing Finance Survey are not annual, so their figures change only with a new survey release.
Sources and references
Follow each source to check the underlying claim. Access checks and professional review are different steps.