The short answer
Usually a few months so far, by Census's American Housing Survey. In 2023, 56% of vacant homes for rent had been empty less than 3 months when the Census Bureau interviewed, and 72% less than 6 months; 19% had been empty a year or more. That is time vacant so far, not the full length of a vacancy.
Key takeaways
The key numbers
The 2023 American Housing Survey counted about 3.68 million vacant homes for rent, 35% of the 10.4 million vacant homes in Census's duration-of-vacancy count (our calculation). That count covers units vacant at the interview; homes whose occupants all usually live elsewhere, which Census also groups with vacant units, are not in it; about 0.24 million such homes were for rent (our calculation). Census groups units offered for rent only with units offered for rent or for sale, as it does for the rental vacancy rate, and so do we.
Months vacant here means months since the last occupants moved out (or since a conversion or merger was completed), as of the day the survey interviewed the unit. Shares in this table are among units that had been lived in before, which leaves out the about 1% that had never been occupied; the month-by-month table below includes them.
| Measure | Estimate |
|---|---|
| Vacant homes for rent (for rent only, or for rent or for sale) | 3.68 million (±0.16 million) |
| Median months vacant so far, homes for rent | 2 months |
| Vacant less than 3 months, homes for rent | 55.9% (±1.9) |
| Vacant less than 6 months, homes for rent | 71.6% (±1.8) |
| Vacant 1 year or more, homes for rent | 18.6% (±1.6) |
| Vacant 2 years or more, homes for rent | 9.7% (±1.4) |
| Median months vacant so far, homes for sale only | about 5 months |
| Vacant less than 6 months, homes for sale only | 52.7% (±4.3) |
What does months vacant actually measure?
Census defines the measure as the time from when the last occupants moved out to the date of the interview, and its definitions say the figures do not directly measure how long units stay vacant in total. A unit vacant for 2 months at the interview may stay empty for another week or another year.
Two things pull the numbers in opposite directions, by our reading. Units caught partway through a vacancy have not finished it, which makes spells look shorter than they end up. A survey that counts units vacant when interviewed is also more likely to find a unit with a long vacancy than one that filled in two weeks, which makes long spells more common in the count than among all the vacancies a landlord goes through. Which effect is larger is not known, so the figures do not tell you the typical completed vacancy.
So these figures describe the vacant rentals on the market at one time. They are not the typical time it takes to re-rent a unit after a tenant leaves, and the survey does not measure that directly.
How long had vacant rentals been empty?
More than half of vacant homes for rent had been empty less than 3 months: the median was 2 months, and 56% of units previously occupied had been vacant under 3 months. 72% had been vacant less than 6 months.
A smaller group had been empty much longer. 19% had been vacant a year or more, and 10% two years or more, about 0.35 million homes (our calculation). The public file has no answer on why a unit is vacant, so this page cannot say why these units stayed empty.
Homes for sale only had been vacant longer. Their median was about 5 months (4 to 6 across the survey's replicate weights), 53% had been vacant less than 6 months, and 33% a year or more. The differences from homes for rent in the shares under 6 months and a year or more are statistically significant at 90% confidence by our test.
| Months vacant | For rent | Rented, not yet occupied | For sale only |
|---|---|---|---|
| Less than 1 month | 20.1% (±1.6) | 26.2% (±7.6) | 14.7% (±2.8) |
| 1 month up to 2 months | 23.1% (±1.9) | 21.2% (±7.1) | 10.6% (±2.7) |
| 2 months up to 6 months | 27.7% (±1.8) | 18.6% (±5.9) | 25.8% (±4.0) |
| 6 months up to 1 year | 9.7% (±1.2) | 18.8% (±6.7) | 14.3% (±3.0) |
| 1 year up to 2 years | 8.8% (±1.2) | 7.5% (±4.4) | 15.8% (±3.6) |
| 2 years or more | 9.6% (±1.4) | 5.5% (±3.2) | 15.9% (±3.6) |
| Never occupied | 1.0% (±0.4) | 2.1% (±2.3) | 2.9% (±1.4) |
Does it differ by building type or region?
Vacancies in larger buildings were more recent. Among vacant rentals in buildings with 5 or more units, 79% had been vacant under 6 months, against 69% in 2 to 4 unit buildings and 61% for single-family houses. Each of those differences is statistically significant by our test. Vacant single-family rentals were more than twice as likely as those in buildings with 5 or more units to have been empty a year or more (28% against 12%).
The survey does not say why, and the public file has no reason-vacant answers that would separate, for example, units under repair from units waiting for a tenant.
By region, the Midwest had the smallest share vacant under 6 months (63%), significantly below the South (73%) and the West (77%). The Northeast (69%) was significantly below the West but not different from the Midwest or South at 90% confidence. Manufactured homes for rent are too few in the sample for reliable estimates; their margins of error are about 11 to 12 points.
| Group | Vacant for rent | Vacant under 6 months | Vacant 1 year or more |
|---|---|---|---|
| Single-family house | 0.94 million | 60.7% (±4.2) | 28.3% (±4.0) |
| 2 to 4 units | 0.58 million | 69.0% (±4.4) | 19.1% (±3.6) |
| 5 or more units | 2.04 million | 79.3% (±2.1) | 12.2% (±1.8) |
| Manufactured home (small sample) | 0.13 million | 41.2% (±12.1) | 46.9% (±11.3) |
| Northeast | 0.44 million | 69.4% (±4.8) | 19.9% (±3.9) |
| Midwest | 0.69 million | 63.0% (±5.4) | 25.8% (±4.8) |
| South | 1.78 million | 73.2% (±2.9) | 17.5% (±2.7) |
| West | 0.77 million | 76.8% (±3.1) | 14.1% (±3.0) |
What about rentals already leased but not yet moved into?
About 206 thousand vacant homes (±39 thousand) had been rented but the new tenant had not moved in. Census classifies a unit this way when rent has been paid or agreed but the renter has not yet arrived. By our reading, these units are nearer to a completed time to lease, since a renter has been found, though months vacant still runs to the interview, not to the signing or move-in.
67% of them had been vacant less than 6 months and their median was 2 months. That is not significantly different from homes still for rent, and with only 147 sample units the margins of error are wide (about ±7 to 8 points).
What this means for landlords
These are considerations, not predictions for any one property.
- Your own turnover history is likely a better guide to your vacancy time than a national figure, because these numbers mix every kind of market and unit.
- When budgeting for vacancy, the national picture may support planning for a few months while allowing for longer gaps: 19% of the vacant rentals on the market had been empty a year or more at interview, though that is not the chance that any one vacancy lasts that long.
- The vacancy cost and turnover cost calculators linked below can turn a vacancy length into lost rent and make-ready costs for your unit.
- If a unit has been on the market far longer than nearby units, the reasons the survey cannot show here, such as price, condition or marketing, are the ones you can check directly.
Methodology
We tabulated the 2023 American Housing Survey national public use file, version 1.1, keeping vacant interviews (INTSTATUS = 3). Vacancy status comes from VACANCY and months vacant from VACMONTHS, coded 0 for less than 1 month, 1 to 24 for months, 25 for more than 2 years and 26 for never occupied. Building type comes from BLD and region from the census division. Estimates use the full-sample weight.
Margins of error are at 90% confidence, from the 160 replicate weights with Census's Fay's-method formula (4/160 times the sum of squared replicate differences). Medians are of whole months as reported and were the same in every replicate for homes for rent. Comparisons between groups are our z-tests treating the groups as independent, which follows the rule for differences in section 5.3 of Census's 2023 national sample design document.
Before using the file, we reproduced Census's published 2023 duration-of-vacancy estimates for all vacant units: all eight counts matched to the thousand, and our margins of error matched Census's within 1 thousand.
Limitations
- Months vacant is time vacant so far at the interview, not the full length of a vacancy: by our reading, units not yet re-rented have not finished their vacancy, and counting units that are vacant when interviewed over-represents long vacancies. The figures do not give the typical time to re-rent a unit.
- The public file has no reason-vacant answers, so this page cannot separate units being repaired, held off the market or priced above the market.
- The public file has a rent amount for vacant units, but Census's definitions describe rent only as asked of renters and do not explain what the amount means for a vacant unit, so this page does not report asking rents.
- The 2023 survey is the latest national AHS. HUD is moving the survey to continuous data collection, which Census said would begin January 2026 or later, so there was no 2025 survey; a newer national release has no announced date.
- Regional and building-type groups have fewer sample cases than the national figure, and manufactured homes for rent are too few for reliable estimates.
- For the current rental vacancy rate, Census's quarterly Housing Vacancy Survey is the usual source; this page links to pages that cover it rather than repeating it.
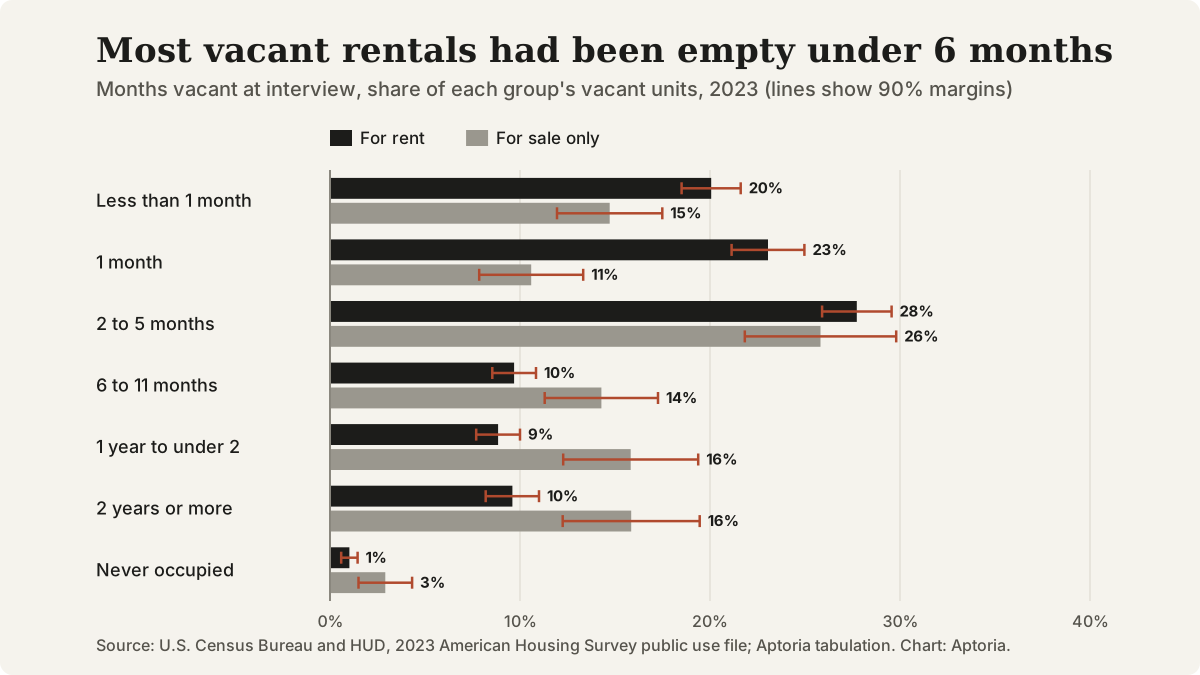
Months vacant at interview for vacant homes for rent and homes for sale only, 2023. Source: American Housing Survey public use file; Aptoria tabulation.
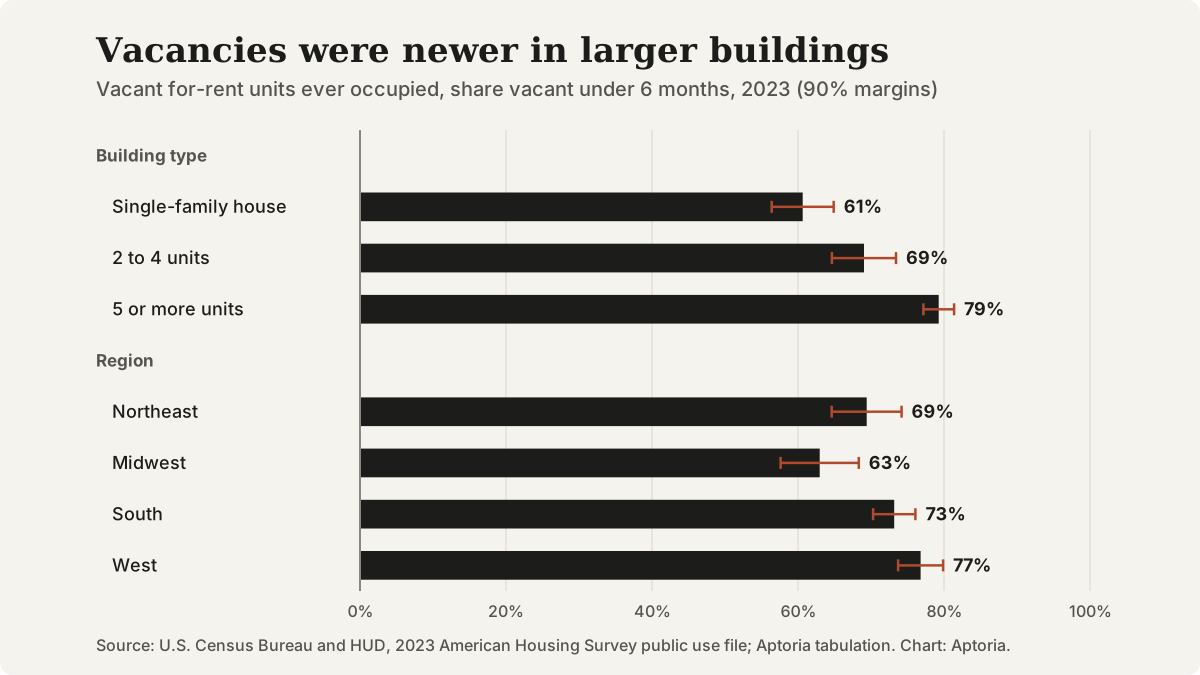
Share of vacant homes for rent (previously occupied) that had been vacant under 6 months, by building type and region, 2023. Source: American Housing Survey public use file; Aptoria tabulation.
Questions that come up
Does this page show how long it takes to rent out a unit?
No. The survey records how long each vacant unit had been empty when it was interviewed, not how long the whole vacancy lasted. Census says the data do not directly measure how long units stay vacant, so treat the figures as a snapshot of vacant rentals, not a typical re-rental time.
How is this different from the rental vacancy rate?
The rental vacancy rate is the share of the rental stock that is vacant and for rent at a point in time. This page is about how long those vacant units had been empty. The rental vacancy rate pages linked below cover the rate nationally and by metro.
Why had homes for sale been vacant longer than homes for rent?
The survey shows the gap (a median of about 5 months against 2) but not the cause. Homes listed for sale and homes listed for rent are different markets, and the public file has no reason-vacant answers.
When will newer figures be available?
There is no set date. HUD is moving the American Housing Survey to continuous data collection, which Census said would start in January 2026 or later, so no 2025 survey was collected. This page will be updated when new national data are published.
Sources and references
Follow each source to check the underlying claim. Access checks and professional review are different steps.