The short answer
No official count of landlords exists. The closest figure comes from the IRS: for tax year 2023, about 9.2 million individual income tax returns reported net income or a net loss from rental real estate on Schedule E, our sum of two IRS counts. That counts returns, not people or properties, and includes commercial, vacation and land rentals.
Key takeaways
The key numbers
Each source counts something different: tax returns, business returns or firms. None counts people who own rentals, and only the employer-firm count is limited to residential lessors.
About 4.9 million individual returns reported rental real estate net income for tax year 2023 and about 4.3 million reported a net loss. That is about 5.7 of every 100 individual returns filed.
| Measure | Count | Year | What it counts |
|---|---|---|---|
| Individual returns reporting rental real estate net income | 4,886,466 | Tax year 2023 | Tax returns, sampled (90% margin about ±2.0%) |
| Individual returns reporting a rental real estate net loss | 4,336,173 | Tax year 2023 | Tax returns, sampled (90% margin about ±2.1%); includes nondeductible losses |
| Returns reporting either (our sum) | 9,222,639 | Tax year 2023 | Tax returns; all property types, not only homes |
| Nonemployer businesses leasing real estate (NAICS 5311) | 1,380,438 | 2024 | Business tax returns with no paid employees; residential and nonresidential |
| of which partnerships | 1,140,747 | 2024 | Includes multi-member LLCs taxed as partnerships |
| of which sole proprietorships | 60,240 | 2024 | Self-employed individuals' unincorporated businesses |
| Employer firms leasing residential buildings (NAICS 53111) | 54,251 | 2022 | Firms with paid employees |
| of which firms with fewer than 5 employees | 43,397 | 2022 | Employment of the whole enterprise |
What does the IRS figure count?
Returns that reported a net income or net loss from rental real estate in Part I of Schedule E. The IRS Statistics of Income Division builds its rent figures from line 21 of Schedule E, Part I: rents received minus expenses such as depreciation, repairs, interest, taxes and insurance, with one column for each property. Royalties are tabulated separately and are not in these counts.
Schedule E lists eight property types, including single-family and multi-family residences, vacation and short-term rentals, commercial property, land and self-rentals, and Table 1.4 does not split rent by property type. So the count covers more than residential landlords.
It also misses some owners. Rentals held inside a partnership or S corporation reach individual returns through a separate part of Schedule E and are not in the rent counts. A married couple filing jointly is one return. One owner with many properties is still one return.
Rentals held in a single-member LLC generally do land here. Under the Schedule E instructions, a single-member domestic LLC is usually disregarded for federal income tax, so its owner reports the rental on Schedule E unless the LLC has elected to be taxed as a corporation.
Is the number of returns reporting rent rising or falling?
Falling. Returns reporting rental real estate income or loss went from 10.5 million for tax year 2013 to 9.2 million for 2023, a decline of about 12%.
The decline is in returns with a net loss, from 5.6 million to 4.3 million (down 22%). Each year's estimate was lower than the year before, though some single-year changes are within sampling error. Returns with net income stayed between 4.8 million and 5.1 million; the 2013 and 2023 figures are not statistically different.
So the balance has reversed. In 2013, more returns reported a rental net loss than net income; by 2023, more reported net income. From 2016 through 2019 the two counts were within sampling error of each other.
The IRS tables show these counts but not why they moved, and this page does not assign a cause. Between 2022 and 2023, neither count changed by more than its sampling error.
| Tax year | Returns with net income | Returns with a net loss | Total (our sum) | Share of all returns (our calculation) |
|---|---|---|---|---|
| 2013 | 4,907,846 | 5,566,404 | 10,474,250 | 7.1% |
| 2014 | 4,977,042 | 5,544,575 | 10,521,617 | 7.1% |
| 2015 | 4,987,608 | 5,414,724 | 10,402,332 | 6.9% |
| 2016 | 5,045,158 | 5,150,862 | 10,196,020 | 6.8% |
| 2017 | 5,061,318 | 5,078,860 | 10,140,178 | 6.6% |
| 2018 | 5,008,468 | 5,007,062 | 10,015,530 | 6.5% |
| 2019 | 4,909,441 | 4,781,407 | 9,690,848 | 6.1% |
| 2020 | 4,826,372 | 4,691,693 | 9,518,065 | 5.8% |
| 2021 | 4,928,465 | 4,490,482 | 9,418,947 | 5.9% |
| 2022 | 4,925,212 | 4,345,158 | 9,270,370 | 5.7% |
| 2023 | 4,886,466 | 4,336,173 | 9,222,639 | 5.7% |
Which returns report rental income?
Most have adjusted gross income under $200,000: about 72% of returns reporting rent for tax year 2023. But reporting rent is far more common at higher incomes, and the share rises with each income group, from about 2.8 of every 100 returns under $50,000 to 28.0 of every 100 at $500,000 or more.
Adjusted gross income includes the rental result as allowed on the return, along with wages and other income, so these groups describe the whole return, not the rental.
| Adjusted gross income | Returns reporting rent | Share of returns reporting rent | Per 100 returns in the income group |
|---|---|---|---|
| Under $50,000, including returns with no AGI | 2,188,114 | 23.7% | 2.8 |
| $50,000 to under $100,000 | 1,920,815 | 20.8% | 4.8 |
| $100,000 to under $200,000 | 2,530,376 | 27.4% | 9.2 |
| $200,000 to under $500,000 | 1,862,524 | 20.2% | 17.0 |
| $500,000 or more | 720,809 | 7.8% | 28.0 |
What about landlords that operate as businesses?
Census counts 1.4 million nonemployer businesses, meaning businesses with no paid employees, in Lessors of Real Estate for 2024. That industry group also covers lessors of nonresidential buildings, miniwarehouses and self-storage, and other real estate, and the nonemployer data do not publish residential lessors separately. Each business income tax return with receipts of $1,000 or more counts once.
About 83% of them are partnerships, the default tax classification for a domestic LLC with two or more members, and about 4% are sole proprietorships. Our reading is that the small number of sole proprietorships fits the IRS instruction that rental real estate is generally reported on Schedule E, even when it is also a trade or business. The count grew every year from 2016 to 2024, up 19% overall.
Businesses with paid employees are a much smaller group. Census counted 54,251 employer firms in Lessors of Residential Buildings and Dwellings in 2022, and about 80% had fewer than five employees across the whole enterprise.
The same person can appear in more than one count. Someone who owns one rental directly and a share of another through an LLC is in the individual rent count and also behind a partnership in the business count, so adding the counts would double-count such owners.
| Legal form | 2016 | 2024 | Change (our calculation) |
|---|---|---|---|
| Partnerships | 946,269 | 1,140,747 | 20.6% |
| S corporations | 131,926 | 137,132 | 3.9% |
| Sole proprietorships | 45,583 | 60,240 | 32.2% |
| C corporations and other corporations | 39,886 | 42,319 | 6.1% |
| All nonemployer lessors of real estate | 1,163,664 | 1,380,438 | 18.6% |
What this means for landlords
These are considerations to weigh, not tax, legal or financial advice.
- When you see a national landlord count, check what it counts. Tax returns, business filings, rental properties and units each give a different total, and a figure that does not say which is hard to use.
- If you report rentals on Schedule E, you are in the largest group these sources count: about 9.2 million individual returns, against about 1.4 million nonemployer lessor businesses and 54,251 employer firms leasing residential buildings. Benchmarks drawn from employer firms describe a small slice of owners.
- A net loss in these tables is not the same as a deductible loss. The IRS counts include losses that passive activity rules made nondeductible. How those rules apply to you is a question for a tax professional.
- Holding a rental personally, through a single-member LLC or through a multi-member LLC changes which tax return reports it, which is one reason sources disagree. This page does not say which structure fits you; ask an attorney or tax professional.
Methodology
We downloaded IRS Statistics of Income Table 1.4 for tax years 2013 to 2023 and its companion coefficient-of-variation tables. A script locates the Rent columns by their header labels in each year's file and reads the all-returns totals and, for 2023, the counts by adjusted gross income. We also checked the 2022 and 2023 totals against Statistics of Income's line item estimates.
The total of returns reporting rent is the net-income count plus the net-loss count. Statistics of Income classifies each return once, by the combined Schedule E line 21 result of all its rental properties, so the two counts do not overlap. For tax years 2022 and 2023 the sums (9,270,370 and 9,222,639) equal the number of returns with a line 21 rental entry in IRS Publication 4801, Line Item Estimates, and the net-income amount minus the net-loss amount equals the line 21 rental amount there. For 2013 to 2021 we apply the same classification.
Margins of error are 90% intervals from the published coefficients of variation. Statements that a count rose or fell compare years as independent samples; for the total, we used a conservative error that assumes the two components move together. Statistics of Income does not publish the covariance.
Nonemployer counts are the national rows for NAICS 5311 in Census's 2016 to 2024 files, by legal form; the script checks that the legal forms add to the total. Employer counts are the national rows for NAICS 53111 in the 2022 Statistics of U.S. Businesses file; employment size there counts employees on the payroll in the pay period including March 12. Shares, sums and percentage changes are our calculations, rounded once at display.
Source: Internal Revenue Service, Statistics of Income DivisionSource: Internal Revenue Service, Statistics of Income DivisionSource: Internal Revenue Service, Statistics of Income DivisionSource: Internal Revenue Service, Statistics of Income DivisionSource: Internal Revenue Service, Statistics of Income DivisionSource: Internal Revenue Service, Statistics of Income DivisionSource: U.S. Census BureauSource: U.S. Census BureauSource: U.S. Census Bureau
Limitations
Keep these limits in mind.
- No source here counts people. Joint returns combine two people, one person can own through several entities, and co-owners of one property may each file.
- The IRS rent counts include commercial property, land, vacation homes and other property types, and exclude rentals held through partnerships and S corporations and those reported on Schedule C.
- The IRS figures are estimates from a sample of returns. Tax year 2023 is the latest year in Table 1.4; the latest complete report with full definitions is for tax year 2022, and the 2023 table uses the same column headings.
- Returns with no net rental result do not appear in either count. For tax year 2022, IRS line item estimates show 9,567,585 returns listing a rental property on Schedule E, about 0.3 million more than the 9,270,370 with a rental net income or loss.
- Farm rentals reported on Form 4835 are tabulated separately by Statistics of Income and are not in the rent counts.
- The nonemployer figures cover all lessors of real estate, not only residential lessors, and count business returns rather than owners.
- The employer firm count is for 2022, the latest Statistics of U.S. Businesses edition, and covers only firms with paid employees.
- This page does not forecast how many landlords there will be.
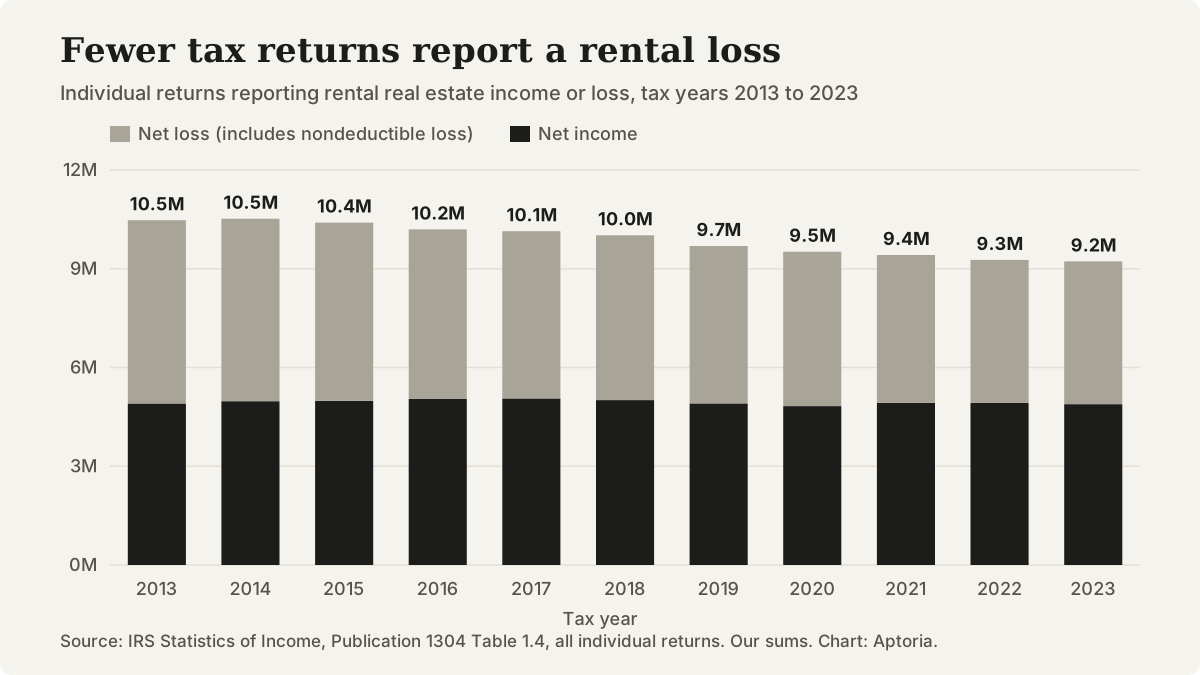
Individual income tax returns reporting rental real estate net income or net loss on Schedule E, tax years 2013 to 2023. Source: IRS Statistics of Income, Table 1.4; totals are Aptoria sums.
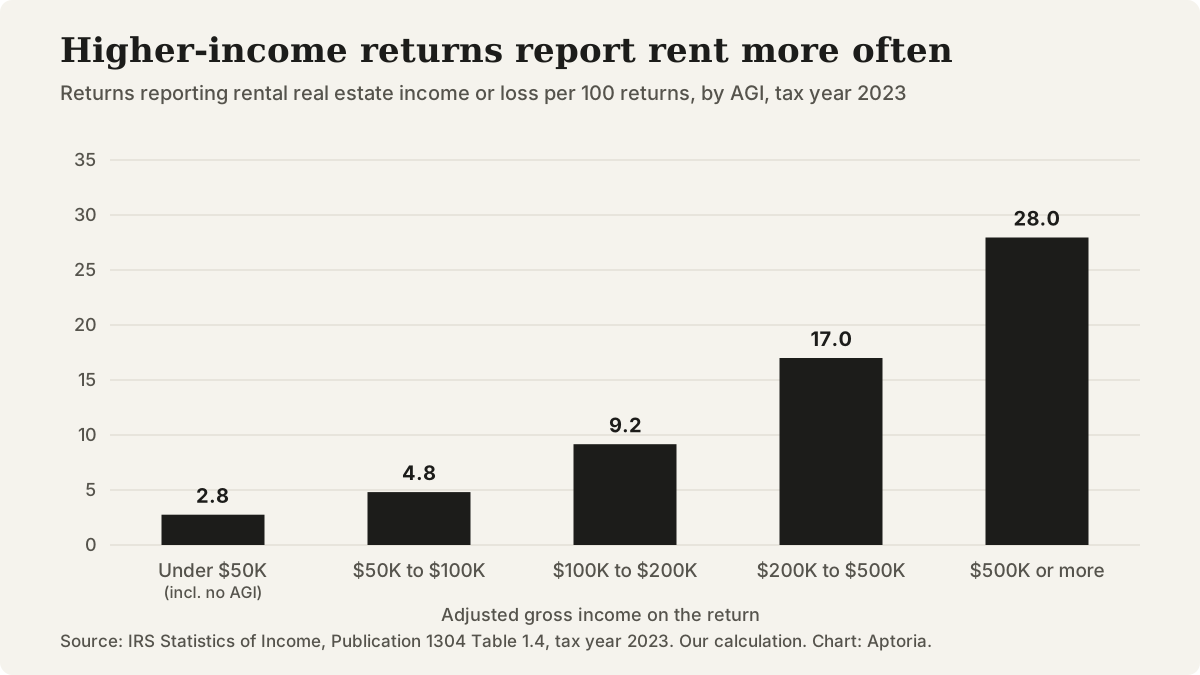
Returns reporting rental real estate income or loss per 100 individual returns, by adjusted gross income, tax year 2023. Source: Aptoria calculation from IRS Statistics of Income, Table 1.4.
Questions that come up
Does renting out a room in my home show up in these counts?
It can. The Schedule E instructions say income from renting a room or other space is rental income, so a return that reports it on Schedule E is counted. Whether and how a particular rental must be reported depends on your facts; a tax professional can tell you.
Are short-term rental hosts included?
Partly. Vacation and short-term rentals are a Schedule E property type, so hosts who report there are included. Hosts who provide significant services such as maid service report on Schedule C instead, per the Schedule E instructions, and are not in these rent counts.
Does this page say whether a rental loss is deductible?
No. It reports how many returns showed a loss. The IRS counts include losses that could not be deducted that year, and the rules depend on your income and participation, so ask a tax professional.
When will newer figures be available?
As of October 24, 2026, tax year 2023 is the latest year the IRS has posted for Table 1.4. This page will be updated when tax year 2024 tables appear, and when Census releases newer nonemployer and employer business data.
Sources and references
Follow each source to check the underlying claim. Access checks and professional review are different steps.