The short answer
About one in ten home-purchase loans. In 2025, 10.1% of the 3.44 million first-lien home-purchase loans reported under the Home Mortgage Disclosure Act were for investment properties the borrower would not live in, up from 7.6% in 2018. Cash purchases are not counted. For 2–4 unit buildings the share was 52.1%.
Key takeaways
The key numbers
These counts cover home purchases financed with a mortgage that lenders reported under the Home Mortgage Disclosure Act (HMDA). The shares are our calculations from the public loan-level records.
| Measure | 2025 | 2018 | Source |
|---|---|---|---|
| Home-purchase loans (first lien) | 3,444,992 | 4,223,833 | HMDA |
| Loans for investment properties | 347,452 | 321,765 | HMDA |
| Investment-property share of all purchase loans | 10.1% | 7.6% | HMDA |
| Second-home share of all purchase loans | 2.7% | 4.2% | HMDA |
| Investment share, 1-unit homes | 8.3% | 6.0% | HMDA |
| Investment share, 2–4 unit buildings | 52.1% | 50.9% | HMDA |
| Investment share, 5+ unit buildings | 99.6% | 99.4% | HMDA |
What counts as an investor purchase in these figures?
Lenders report each loan's occupancy as one of three types: principal residence, second residence or investment property. Under the Regulation C commentary, a property is an investment property when the borrower does not or will not occupy it. That includes a home bought to rent out and one bought to resell, and it includes a company buying a home it will not occupy.
A second residence is a home the borrower occupies for part of the year that is not their principal residence. The commentary says a home the buyer lives in for part of the year and rents out for the rest is a second residence, so some part-time rentals fall outside the investment category.
We count only first-lien loans, so a purchase financed with a first mortgage and a second piggyback loan counts once. Loans reported as reverse mortgages are excluded; loans where lenders reported that field as exempt are kept.
Is investor buying rising?
As a share of financed purchases, yes. The investment-property share was 7.6% in 2018 and 7.4% in 2019, fell to 6.2% in 2020, then rose to 8.4% in 2021 and 9.7% in 2022. After 9.0% in 2023 it reached 9.7% in 2024 and 10.1% in 2025, the highest in the 2018 to 2025 data used here.
The number of investment-property purchase loans peaked in 2021 at 442,547. In 2025 there were 347,452, up 5.2% from 2024. From 2021 to 2025, total first-lien purchase loans fell 34.6% while investment-property loans fell 21.5%, so the investor share rose even as the count fell.
Over the same years the second-home share moved the other way, from a high of 5.0% in 2021 to 2.7% in 2025. We did not find a primary source that explains the shift, so this page does not attribute a cause to either trend.
| Year | Purchase loans | Investment-property loans | Investment share | Second-home share |
|---|---|---|---|---|
| 2018 | 4,223,833 | 321,765 | 7.6% | 4.2% |
| 2019 | 4,382,915 | 326,358 | 7.4% | 4.2% |
| 2020 | 4,786,873 | 298,013 | 6.2% | 4.9% |
| 2021 | 5,267,707 | 442,547 | 8.4% | 5.0% |
| 2022 | 4,257,542 | 412,892 | 9.7% | 3.6% |
| 2023 | 3,334,891 | 300,519 | 9.0% | 2.8% |
| 2024 | 3,396,852 | 330,140 | 9.7% | 2.6% |
| 2025 | 3,444,992 | 347,452 | 10.1% | 2.7% |
Which properties do investors finance?
Most financed purchases are of 1-unit properties, and 8.3% of loans on 1-unit properties were for investment properties in 2025. Two- to four-unit buildings are different: 52.1% of the 98,597 purchase loans on these buildings were for investment properties, and 47.4% were for a principal residence.
Because the definition turns on whether the borrower occupies the property, our reading is that a buyer who lives in one unit of a duplex or fourplex and rents the others would be reported as a principal residence, not an investment property.
Nearly all purchase loans on buildings with 5 or more units, 99.6%, were for investment properties. There were 18,936 such loans in 2025. Each loan is secured by a whole property, which can include more than one building, so the count is of loans, not units.
Where is the investor share highest?
In 2025 the investment-property share was highest in Hawaii (17.1%), Arkansas (15.9%) and Oklahoma (14.9%), and lowest in Alaska (5.7%). The median across the 50 states and DC was 9.8%.
The share was higher in 2025 than in 2018 in 49 of the 51; Colorado and Oregon were the exceptions. These are shares of mortgage-financed purchases only. Cash purchases are not included and may be more common in some states than others, so the figures are not a full count of investor buying in each state.
| State | 2025 share | 2025 purchase loans | 2018 share |
|---|---|---|---|
| Hawaii | 17.1% | 9,764 | 12.8% |
| Arkansas | 15.9% | 36,854 | 13.8% |
| Oklahoma | 14.9% | 46,042 | 13.2% |
| New Jersey | 13.7% | 78,581 | 7.8% |
| Missouri | 13.3% | 76,731 | 10.8% |
| New York | 12.1% | 117,644 | 7.9% |
| California | 12.1% | 248,603 | 10.2% |
| Kansas | 12.1% | 32,531 | 9.9% |
| Nebraska | 12.0% | 22,682 | 9.6% |
| Pennsylvania | 12.0% | 118,937 | 8.0% |
| Michigan | 7.0% | 104,273 | 4.3% |
| Minnesota | 7.0% | 65,263 | 6.4% |
| Colorado | 6.8% | 76,612 | 7.6% |
| New Mexico | 6.2% | 19,661 | 5.8% |
| Alaska | 5.7% | 7,441 | 4.4% |
How does this compare with NAR's investor figure?
The National Association of Realtors reports that individual investors and second-home buyers accounted for 20% of existing-home transactions in September 2026, and that cash sales were 27%. NAR derives these shares from its monthly Realtors Confidence Index survey.
The HMDA figures on this page are a different measure: lender-reported loans for a full year, covering new and existing homes but only purchases financed with a mortgage. Investment properties and second homes together were 12.8% of 2025 first-lien purchase loans. The two sources should not be read as estimates of the same number.
What this means for landlords
These are considerations to weigh against your own market, not financial, lending or legal advice.
- If you are buying single-family rentals, other financed investors were behind about one in twelve 1-unit purchase loans in 2025 nationally, and the share varies a lot by state. Local data will tell you more than the national figure.
- If you own a 2–4 unit building, nearly half of the financed purchases of these buildings in 2025 were reported as the buyer's principal residence. When you sell, the buyer pool may include owner-occupants as well as investors.
- If you are weighing a purchase, the DSCR and cap rate calculators can help you test whether the rent covers the debt and expenses at today's prices.
- The HMDA Data Browser lets you filter the same public data by state, metro area or county if you want a closer look at your own market.
- A rising investor share describes the market as a whole. It does not say whether any particular property is a good purchase.
Methodology
We streamed every originated home-purchase loan for 2018 to 2025 from the HMDA Data Browser API's nationwide CSV endpoint and tallied the records by year, state, occupancy type, total units, lien status and reverse-mortgage flag. The raw records were not stored; only the tally was kept. No applicant demographic field was used or kept.
For every year, the number of records we tallied matches the API's own aggregation count, and for 2018 and 2025 the count for each of the 50 states and DC also matches. Shares are investment-property loans divided by all first-lien purchase loans, excluding loans reported as reverse mortgages and including loans on manufactured homes. National figures include the small number of records for U.S. territories or without a state code; excluding them changes the 2025 share by less than 0.1 percentage point. Figures are rounded once, at display.
The Data Browser uses the latest frozen dataset for each year: the three-year dataset for 2018 to 2022, the one-year dataset for 2023 and 2024, and the snapshot dataset for 2025 (frozen June 2, 2026). We retrieved all years on 2026-10-24.
Source: Federal Financial Institutions Examination Council (FFIEC) and Consumer Financial Protection BureauSource: Federal Financial Institutions Examination Council (FFIEC) and Consumer Financial Protection BureauSource: Federal Financial Institutions Examination Council (FFIEC) and Consumer Financial Protection BureauSource: Federal Financial Institutions Examination Council (FFIEC) and Consumer Financial Protection Bureau
Limitations
Keep these limits in mind.
- HMDA covers loans, not purchases. Cash purchases are missing, and the investor share of all purchases could be higher or lower than the share of financed purchases.
- Only lenders that meet HMDA's reporting thresholds file data, and the closed-end threshold changed during this period: a 2020 rule raised it from 25 to 100 loans, effective July 1, 2020, and a federal court vacated that increase in 2022, restoring 25. Year-to-year counts therefore do not come from an identical set of lenders.
- Lenders can resubmit data for about three years (2025 data until December 31, 2028). The 2023 to 2025 figures here come from earlier frozen datasets and may change slightly when later versions are published.
- Occupancy is what the lender reported for the loan. HMDA does not record what the buyer later did with the property.
- This page does not separate individual investors from companies, and it does not measure rentals bought without a mortgage.
- This page does not forecast investor buying.
Source: Federal Financial Institutions Examination Council (FFIEC) and Consumer Financial Protection BureauSource: Consumer Financial Protection BureauSource: Federal Financial Institutions Examination Council (FFIEC) and Consumer Financial Protection BureauSource: Federal Financial Institutions Examination Council (FFIEC) and Consumer Financial Protection Bureau
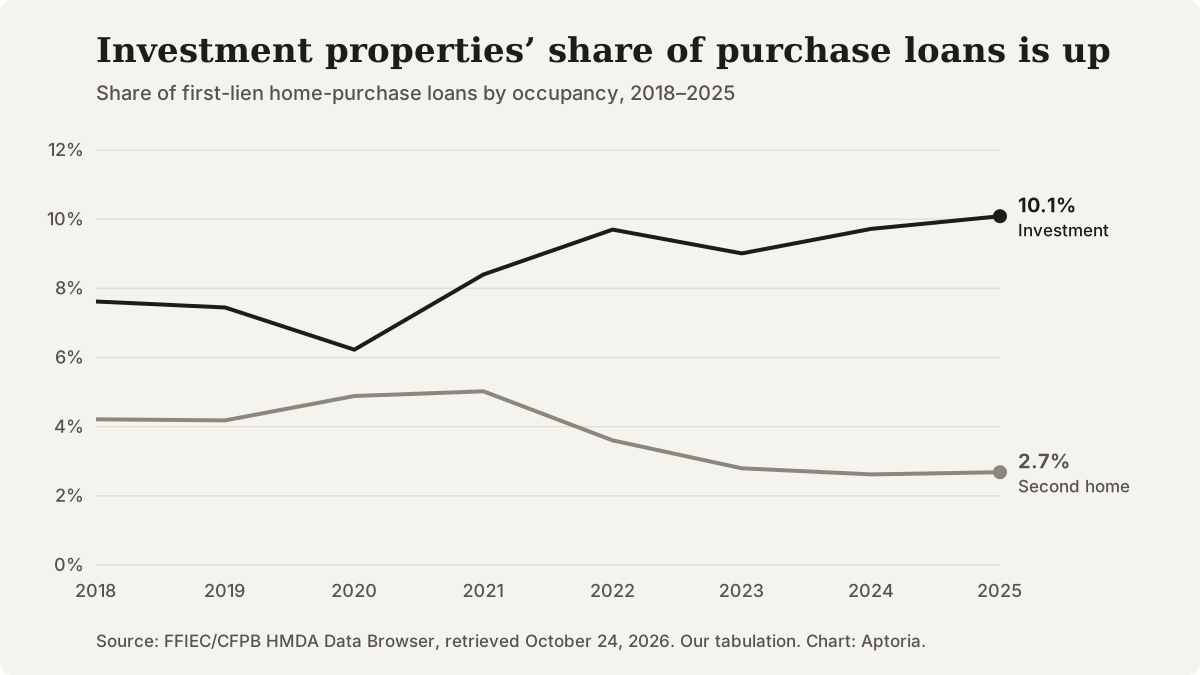
Share of originated first-lien home-purchase loans for investment properties and second homes, 2018 to 2025. Source: HMDA Data Browser, our tabulation.
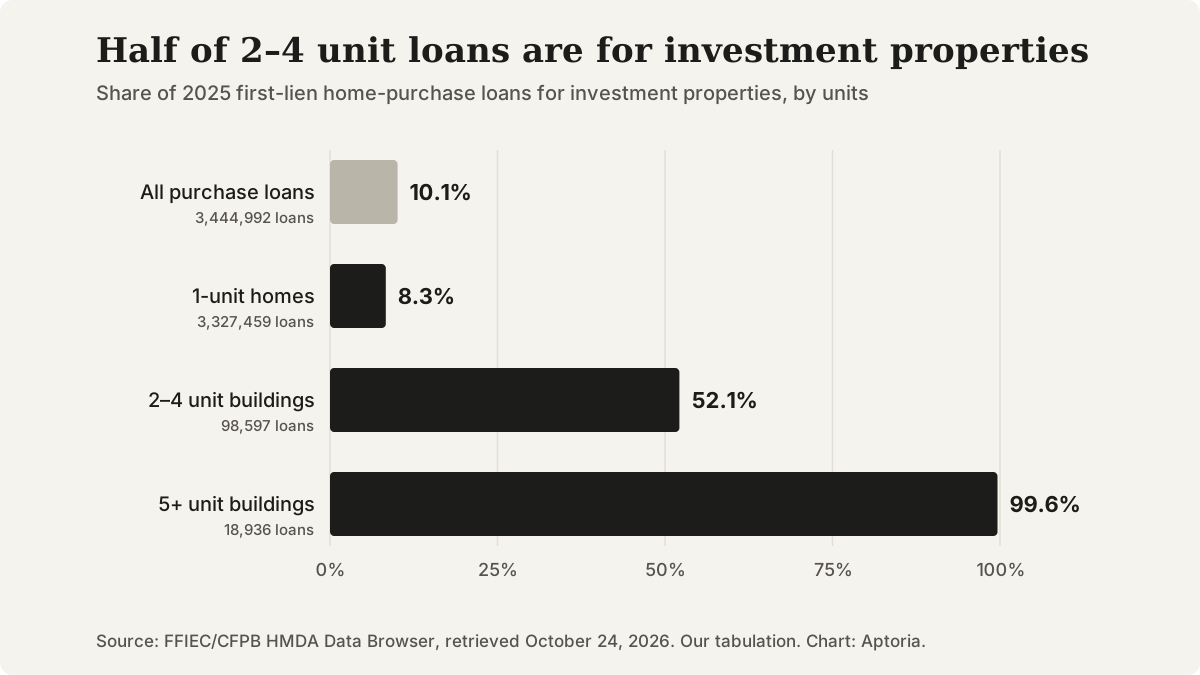
Share of 2025 originated first-lien home-purchase loans for investment properties, by number of units. Source: HMDA Data Browser, our tabulation.
Questions that come up
Do these figures include cash purchases?
No. HMDA records mortgage loans, so a home bought without a mortgage does not appear. NAR's survey found cash sales were 27% of existing-home transactions in September 2026.
Is a buyer who lives in one unit of a duplex counted as an investor?
Probably not. The official interpretation of Regulation C defines an investment property as one the borrower does not or will not occupy. It does not address multi-unit buildings directly, but in our reading a buyer who lives in one unit would be reported as a principal residence. In 2025, 47.4% of purchase loans on 2–4 unit buildings were for a principal residence.
Does this page show how much large institutional investors buy?
No. The figures cover all borrowers buying investment properties with a mortgage, from individuals to companies, and this page does not split them by type or size.
When will 2026 figures be available?
Lenders file 2026 data from January 1 to March 1, 2027. For 2025, institution-level files were published on March 31, 2026, and the national snapshot used by the Data Browser was frozen on June 2, 2026. If the schedule repeats, 2026 figures would be available around mid-2027.
Sources and references
Follow each source to check the underlying claim. Access checks and professional review are different steps.