The short answer
Not many places, and the answer depends on the measure. FHFA's repeat-sales index was higher than a year earlier in 46 states and D.C. in Q2 2026 and fell in 4, led by New Mexico (−1.2%). Zillow's typical-value estimate was lower than a year earlier in 11 states in September 2026, all in the South or West, including Texas and Florida.
Key takeaways
How many places have falling prices?
Few, on either measure. FHFA counts 4 of 51 (the 50 states and D.C.) with lower prices than a year earlier in Q2 2026, and 24 of its 100 largest metro areas. Zillow's estimates put the number of falling states at 11 and falling large metros at 16 of 49 in September 2026. Nationally, FHFA's index rose 2.1% over the year to Q2 2026 and Zillow's rose 1.2% over the year to September 2026.
Counts here use each measure's unrounded change, so a place shown at 0.0% after rounding can still count as rising or falling.
| Measure | Areas falling | Areas rising | Period |
|---|---|---|---|
| FHFA index, 50 states and D.C. | 4 | 47 | Year to Q2 2026 |
| FHFA index, 100 largest metros | 24 | 76 | Year to Q2 2026 |
| Zillow typical value, 50 states and D.C. | 11 | 40 | Year to September 2026 |
| Zillow typical value, 49 of the 50 largest metros | 16 | 33 | Year to September 2026 |
Which states have falling home prices?
On FHFA's index, New Mexico, Washington, Colorado and California were lower than a year earlier in Q2 2026. All four are in the West. FHFA's own release lists the same count and names New Mexico's 1.2% as the largest decline.
On Zillow's estimates for September 2026, 11 states were lower, with the largest declines in Nevada, Texas and Colorado. Of those, 7 are in the South and 4 in the West, using the Census Bureau's regions.
The table lists every state that was lower on at least one measure. Because FHFA's latest data end in Q2 2026, the middle column compares Zillow over the same period, to June 2026.
| State | FHFA, year to Q2 2026 | Zillow, year to June 2026 | Zillow, year to September 2026 |
|---|---|---|---|
| Nevada | +2.8% | −2.1% | −1.6% |
| Texas | +0.5% | −1.9% | −1.4% |
| Colorado | −0.5% | −2.0% | −1.3% |
| Arizona | +0.6% | −1.6% | −1.0% |
| Florida | +1.0% | −2.8% | −0.9% |
| District of Columbia (FHFA small-sample flag) | +1.7% | −2.3% | −0.7% |
| Georgia | +1.9% | −0.9% | −0.6% |
| Washington | −0.9% | −0.6% | −0.5% |
| Kentucky | +4.3% | −1.0% | −0.2% |
| North Carolina | +0.4% | slightly below 0% | −0.2% |
| Maryland | +1.0% | +0.1% | −0.1% |
| Oregon | +0.3% | −0.5% | slightly above 0% |
| California | −0.2% | −0.4% | +0.6% |
| Hawaii (FHFA small-sample flag) | +5.8% | −0.1% | +1.4% |
| New Mexico | −1.2% | +1.3% | +1.7% |
Why do FHFA and Zillow disagree?
They measure different things. FHFA's purchase-only index tracks repeat sales of the same single-family homes, using mortgages that Fannie Mae or Freddie Mac bought or securitized; according to FHFA, its sample has no condos or co-ops, homes in buildings with several units, or homes in planned developments. Zillow describes ZHVI as the typical value of homes in the 35th to 65th percentile range, and the series used here covers single-family homes and condos or co-ops. Zillow says the index draws on its automated Zestimate values for more than 100 million homes.
Over the same period, the two agreed on direction in 40 of 51 states. In the other 11, one rose while the other fell. The widest gaps were in Hawaii, Kentucky and Nevada, where FHFA showed gains of +5.8%, +4.3% and +2.8% and Zillow showed −0.1%, −1.0% and −2.1%. The data alone do not say which measure is closer for any one state.
FHFA attaches a small-sample note to 7 areas, including Alaska, Delaware and the District of Columbia, because they had under 15,000 sales in its data over the past decade, so their changes rest on less data.
Which large metro areas are falling?
On FHFA's index, 24 of the 100 largest metro areas were lower than a year earlier in Q2 2026. Everett, WA had the largest decline (−3.7%), followed by San Antonio-New Braunfels, TX and Bakersfield-Delano, CA. FHFA's file lists some of the largest metros as metropolitan divisions (marked MSAD), so areas such as Everett and Seattle appear separately. Since its Q2 2026 release FHFA also publishes whole-metro indexes for the 13 large metros that have divisions; this page ranks the division-level series, which is the set FHFA uses for its 100-largest count.
On Zillow's estimates, 16 of the 49 largest metros in its files were lower in September 2026, led by Austin, TX (−4.3%), Las Vegas, NV and Dallas, TX. Zillow's ranking skips position 33, which is why the list has 49 metros.
The two lists use different metro definitions and names, so this page shows them side by side rather than matching them up.
| Metro area (FHFA name) | Change |
|---|---|
| Everett, WA (MSAD) | −3.7% |
| San Antonio-New Braunfels, TX | −3.0% |
| Bakersfield-Delano, CA | −2.6% |
| Seattle-Bellevue-Kent, WA (MSAD) | −2.4% |
| San Francisco-San Mateo-Redwood City, CA (MSAD) | −2.4% |
| Tucson, AZ | −2.2% |
| Albuquerque, NM | −1.7% |
| San Jose-Sunnyvale-Santa Clara, CA | −1.6% |
| Washington, DC-MD (MSAD) | −1.0% |
| Denver-Aurora-Centennial, CO | −1.0% |
Where are Zillow's estimates falling most?
Four of the ten largest declines in Zillow's estimates for September 2026 were in Texas metros.
| Metro area (Zillow name) | Change |
|---|---|
| Austin, TX | −4.3% |
| Las Vegas, NV | −2.6% |
| Dallas, TX | −2.0% |
| San Antonio, TX | −1.9% |
| Houston, TX | −1.8% |
| Denver, CO | −1.8% |
| Raleigh, NC | −1.7% |
| Seattle, WA | −1.6% |
| Atlanta, GA | −1.5% |
| Orlando, FL | −1.4% |
Is the number of falling markets growing?
Not lately. Both counts rose during 2025 and are now below their recent highs. On FHFA's index the number of falling states was 9 in Q1 2026 (matching its 9 in Q2 2023) and 4 in Q2 2026. On Zillow's estimates, measured at each quarter's last month, it peaked at 17 in Q4 2025 and was 11 in September 2026.
These counts use each publisher's current, revised data, so earlier quarters may differ from what was first reported.
This page does not forecast prices. FHFA's third-quarter figures are scheduled for November 24, 2026.
What this means for landlords
These are considerations to weigh against your own property, not recommendations.
- State and metro indexes describe broad areas. A specific property's value depends on its own condition and recent nearby sales, so compare local comparables before relying on a state figure.
- If prices in your area are flat or lower, the equity available for a cash-out refinance may be smaller than it was a year or two ago. A break-even calculation shows whether a refinance pays back at today's rates.
- If you are thinking about selling, the measures above show direction, not a price. Local listings, days on market and price cuts tell you more about current conditions.
- How and when market values feed into property tax assessments varies by state and locality; our property tax page covers national collections.
- Where FHFA and Zillow disagree, as in Hawaii and Kentucky, treat either single figure with caution.
Methodology
We pull FHFA's quarterly purchase-only state and metro files, FHFA's Q2 2026 release and FAQ, and Zillow's state and metro ZHVI files with a script. Year-over-year changes compare the latest period with the same period a year earlier, using seasonally adjusted values.
Rising and falling counts use unrounded changes; displayed figures are rounded once to one decimal place. The same-period comparison uses Zillow's value at the last month of FHFA's quarter (June 2026). Regions follow the Census Bureau's four-region definitions. We check our FHFA counts against the figures FHFA publishes in its release.
Limitations
Keep these limits in mind.
- FHFA's index covers single-family homes bought with conforming, conventional mortgages that Fannie Mae or Freddie Mac acquired, so other sales, condos and several other property types are outside it.
- Zillow's index is built from model-based value estimates rather than only from sales, and Zillow rebuilt the full series in its January 2023 release.
- FHFA's latest state and metro data end in Q2 2026 (its monthly national and census-division data are more recent), while Zillow's run to September 2026. FHFA says it updates past values as new mortgage data arrive.
- Small changes near zero can switch direction with revisions, and FHFA flags some areas as having small samples.
- FHFA's index is not adjusted for inflation, according to FHFA, and Zillow publishes ZHVI as dollar values.
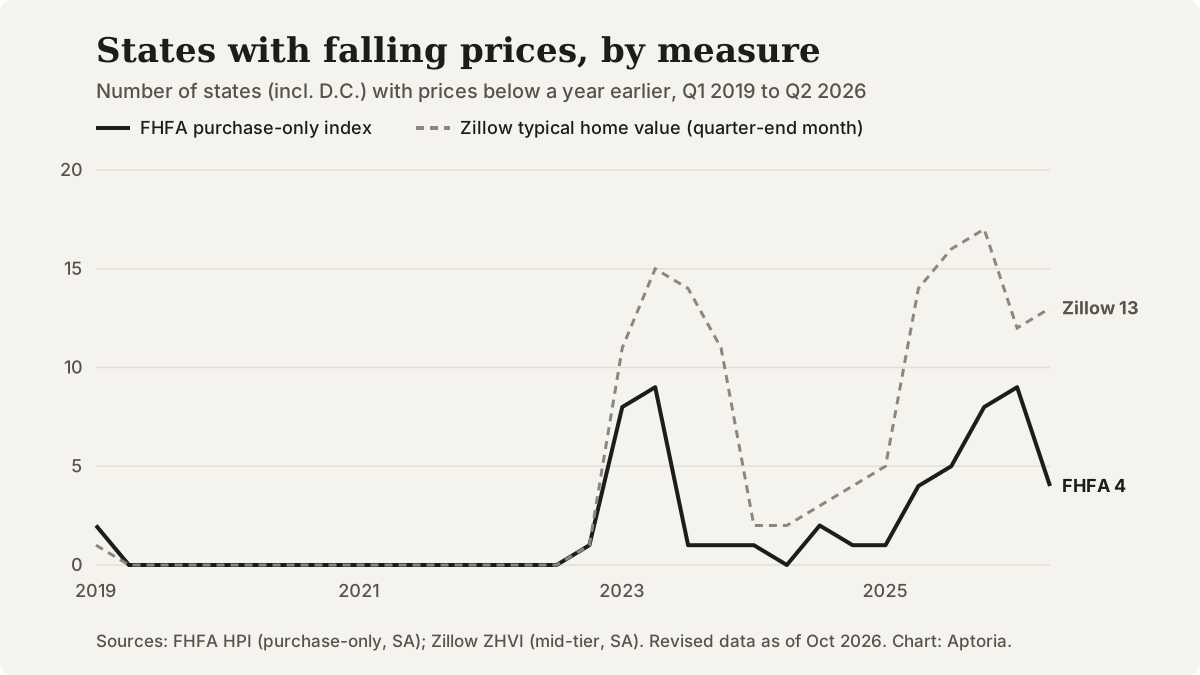
Number of states (including D.C.) with prices below a year earlier, by quarter, on FHFA's purchase-only index and Zillow's typical home value. Sources: FHFA, Zillow.
Questions that come up
What is the difference between a price index and a median sale price?
A repeat-sales index like FHFA's compares sales of the same homes over time, which is designed to limit the effect of which homes happened to sell. A median price is the middle sale in a period and moves when the mix of homes changes. Our housing market page covers the national median.
How often are these figures updated?
FHFA publishes state and metro indexes quarterly; its next quarterly report is scheduled for November 24, 2026. Zillow publishes its index monthly. We plan to refresh this page after each FHFA quarterly release.
Does a falling state index mean my rental lost value?
Not necessarily. A state or metro index summarizes many homes, and individual properties can move differently. An appraisal or a comparison with recent nearby sales is a better guide for one property.
Why does FHFA flag some states?
FHFA adds a note to areas with a small number of sales in its data over the past ten years (under 15,000). In Q2 2026 that applied to Alaska, Delaware, the District of Columbia, Hawaii, Vermont, West Virginia and Wyoming.
Sources and references
Follow each source to check the underlying claim. Access checks and professional review are different steps.