The short answer
By FEMA's National Risk Index, California has the largest expected yearly loss to buildings from natural hazards, about $23.7 billion, or 22% of the U.S. total. Relative to building value, Hawaii, California, Alaska and Louisiana rank highest. Inland flooding accounts for about 59% of expected building losses nationally. These are modeled yearly averages, not forecasts or insurance prices.
Key takeaways
The key numbers
FEMA's National Risk Index estimates how much 18 natural hazards are expected to cost buildings, people and agriculture each year, county by county. This page uses the index's building figures from version 1.20.0, December 2025, the latest release. Across the 50 states and D.C., expected annual loss to buildings comes to about $105.5 billion, our sum of FEMA's state figures.
This product uses the Federal Emergency Management Agency's National Risk Index dataset API or downloadable datasets but is not endorsed by FEMA. The Federal Government or FEMA cannot vouch for the data or analyses derived from these data after the data have been retrieved from the Agency's website(s).
| Measure | Value | Note |
|---|---|---|
| Expected annual loss to buildings | $105.5 billion | Our sum of FEMA's state figures |
| Building value in the index | $69.3 trillion | FEMA's Hazus 6.0, December 2024 dollars |
| Buildings' share of all expected annual loss | 70% | The rest is population and agriculture, in dollars |
| Largest hazard for buildings | Inland flooding, 59% | Our share of the national total |
| States where inland flooding is the top building hazard | 45 of 51 | Hurricane in 3, earthquake in 3 |
| Median state building loss per $100,000 of building value | $136 | Our division of FEMA's loss by building value |
| Counties in the index | 3,144 | Counties and county equivalents in the 50 states and D.C.; 3,232 including territories |
Which states have the largest expected losses to buildings?
California is far ahead, with an expected annual building loss of about $23.7 billion, or 22.4% of the national total. Florida ($7.2 billion) and Texas ($7.1 billion) follow, then Illinois and North Carolina.
Dollar totals track how much building value a state has as well as how hazardous it is, so large states rank high. The loss rate in the next section adjusts for that.
| State | Expected annual building loss | Share of U.S. total | Largest hazard |
|---|---|---|---|
| California | $23.7 billion | 22.4% | Inland flooding |
| Florida | $7.2 billion | 6.8% | Hurricane |
| Texas | $7.1 billion | 6.7% | Inland flooding |
| Illinois | $3.7 billion | 3.5% | Inland flooding |
| North Carolina | $3.5 billion | 3.3% | Inland flooding |
| New York | $3.3 billion | 3.1% | Inland flooding |
| Washington | $3.2 billion | 3.0% | Earthquake |
| Pennsylvania | $3.0 billion | 2.9% | Inland flooding |
| New Jersey | $2.6 billion | 2.5% | Inland flooding |
| Louisiana | $2.6 billion | 2.4% | Hurricane |
Which states face the highest losses relative to building value?
FEMA also publishes an expected annual loss rate, which its glossary presents as a way to compare hazard intensity across places regardless of how much they have exposed, stated as a yearly average percentage loss. For buildings, Hawaii has the highest rate among the 50 states and D.C. Its expected annual building loss equals about $364 a year for every $100,000 of building value, our division of FEMA's loss by FEMA's building value. California ($306), Alaska ($278) and Louisiana ($272) follow.
The District of Columbia has the lowest rate, about $43 per $100,000, followed by Maryland ($60) and Michigan ($85). The median across the 50 states and D.C. is about $136.
| State | FEMA building loss rate | Per $100,000 of building value | Largest hazard |
|---|---|---|---|
| Hawaii | 0.408% | $364 | Inland flooding |
| California | 0.343% | $306 | Inland flooding |
| Alaska | 0.312% | $278 | Earthquake |
| Louisiana | 0.306% | $272 | Hurricane |
| West Virginia | 0.243% | $216 | Inland flooding |
| South Carolina | 0.226% | $201 | Hurricane |
| Florida | 0.221% | $197 | Hurricane |
| Washington | 0.218% | $195 | Earthquake |
| Michigan | 0.095% | $85 | Inland flooding |
| Maryland | 0.067% | $60 | Inland flooding |
| District of Columbia | 0.048% | $43 | Inland flooding |
Which hazards drive expected losses to buildings?
Inland flooding accounts for about 59% of expected annual building loss nationally, our share of FEMA's figures, followed by earthquake (16%), hurricane (11%) and tornado (4%). FEMA's glossary defines inland flooding to include both rivers overflowing their banks and heavy rain overwhelming drainage, and notes it can occur anywhere it rains.
Inland flooding is the largest building hazard in 45 of the 50 states and D.C. Hurricane leads in Florida, Louisiana and South Carolina, and earthquake leads in Alaska, Utah and Washington. In California, inland flooding (49%) and earthquake (43%) are close.
| Hazard | Expected annual building loss | Share of U.S. total |
|---|---|---|
| Inland flooding | $62.65 billion | 59.4% |
| Earthquake | $16.99 billion | 16.1% |
| Hurricane | $11.32 billion | 10.7% |
| Tornado | $4.67 billion | 4.4% |
| Wildfire | $3.67 billion | 3.5% |
| Hail | $2.52 billion | 2.4% |
| Strong wind | $1.38 billion | 1.3% |
| Coastal flooding | $0.92 billion | 0.9% |
| All other hazards | $1.41 billion | 1.3% |
Which counties have the largest expected losses to buildings?
Los Angeles County has the largest expected annual building loss of any county, about $5.9 billion, with earthquake its largest hazard. Seven of the 10 largest are in California. Together the 10 counties account for 19% of the national total, our calculation.
County figures can be read the same way as state figures: dollar totals reflect how much building value a county has, and FEMA's loss rate adjusts for it.
| County | Expected annual building loss | FEMA building loss rate | Largest hazard |
|---|---|---|---|
| Los Angeles County, CA | $5.95 billion | 0.392% | Earthquake |
| Riverside County, CA | $2.04 billion | 0.486% | Inland flooding |
| San Bernardino County, CA | $1.79 billion | 0.473% | Inland flooding |
| Orange County, CA | $1.60 billion | 0.295% | Inland flooding |
| Harris County, TX | $1.59 billion | 0.213% | Inland flooding |
| Santa Clara County, CA | $1.57 billion | 0.411% | Earthquake |
| San Diego County, CA | $1.39 billion | 0.245% | Inland flooding |
| Alameda County, CA | $1.35 billion | 0.407% | Earthquake |
| Cook County, IL | $1.26 billion | 0.141% | Inland flooding |
| Maricopa County, AZ | $1.20 billion | 0.158% | Inland flooding |
What about the U.S. territories?
The index also covers five territories. Four of them have building loss rates above every state: Guam (about $608 per $100,000), American Samoa ($563), the U.S. Virgin Islands ($491) and Puerto Rico ($457), our division of FEMA's loss by building value. The Northern Mariana Islands are at about $355. Territories are left out of the national totals on this page.
What do the National Risk Index scores and ratings mean?
FEMA's scores are national percentile rankings, and its ratings sort places into five categories from very low to very high in comparison with other places at the same level. Both are relative, so a low rating means lower than most other places, not free of risk.
FEMA builds expected annual loss from three factors its glossary names: exposure (the value of buildings, people or agriculture exposed to a hazard), annualized frequency (how often the hazard is expected to occur in a year) and historic loss ratio (the share of exposed value expected to be lost in an occurrence). The result is a yearly average, so actual losses in a given year can be far higher or lower.
The index's composite Risk Index adjusts expected annual loss for social vulnerability and community resilience, two other components FEMA publishes. This page uses expected annual loss only, and FEMA does not publish the Risk Index at the state level.
What this means for landlords
These are considerations, not insurance or investment advice. FEMA says the index is meant for planning and broad nationwide comparisons, not as a substitute for a localized risk assessment.
- A state's figure is an average across all of its buildings. Conditions at one property can differ a great deal, and FEMA publishes county and Census tract data that is closer to a specific address.
- Inland flooding is the largest expected building loss in most states in this data. Our flood insurance page covers how many residential buildings carry federal flood policies and what those policies cover.
- In Alaska, Utah and Washington, earthquake is the largest expected building loss in this data, and in California it is close to inland flooding. Coverage for earthquake damage is a question for a licensed insurance professional.
- FEMA's figures are long-run yearly averages; losses in a year with a major event can be far larger.
- Our insurance cost trends page covers what has happened to homeowners insurance premiums, which are set by insurers and are separate from these estimates.
Methodology
All figures come from FEMA's National Risk Index, version 1.20.0, December 2025, retrieved October 24, 2026 through the feature services FEMA publishes in its ArcGIS Online organization, because FEMA's National Risk Index website blocks automated downloads. State figures come from FEMA's state layer, which FEMA built by adding up county data. County figures come from FEMA's county layer. Definitions come from FEMA's data glossary, metadata and data dictionary for this version.
National totals, each hazard's share of the national total, each state's share and the median state rate are our calculations over the 50 states and D.C. Dollars per $100,000 are FEMA's expected annual building loss divided by FEMA's building value, times $100,000. FEMA's composite building loss rate field is consistently about 12% higher than that ratio in every state and county, and the FEMA documentation we could retrieve does not explain the difference, so we report FEMA's percentages as published and do not convert them. The two measures rank places in the same order. Building values come from FEMA's Hazus 6.0 inventory, inflation adjusted to December 2024 dollars.
Limitations
Read the figures with these limits in mind.
- The index covers buildings in general. FEMA's data dictionary has no field that separates homes or rental housing from other buildings.
- FEMA says the data are meant for planning purposes only and that its nationwide inputs are often less accurate than available local data.
- Expected annual loss is a modeled average over many years, not a prediction for any one year, and it is not an insurance premium.
- Scores and ratings rank places against each other, so a place's rating can change when other places' values change. This page uses version 1.20.0 only and does not compare versions.
- State figures are FEMA's aggregation of county data. For the U.S. Virgin Islands, the sum of the county layer is about 3.6% below the state layer; for every state they match.
- The composite Risk Index, social vulnerability and community resilience are not used on this page.
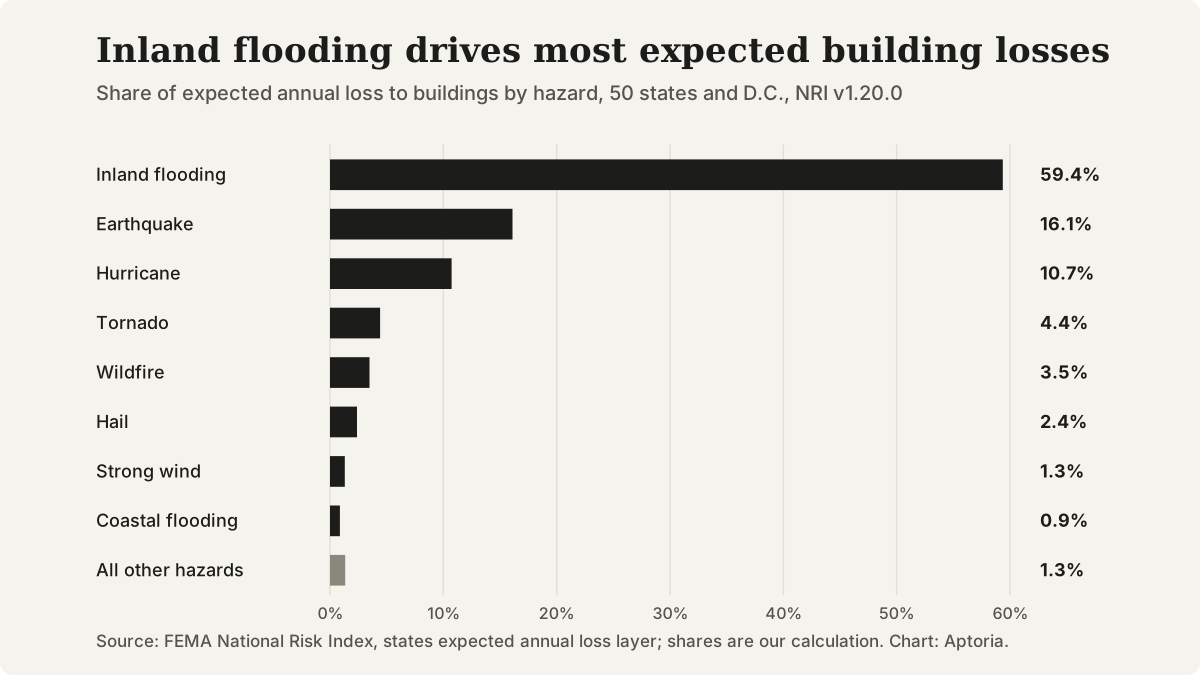
Share of expected annual loss to buildings by hazard, 50 states and D.C. Source: FEMA National Risk Index, version 1.20.0, December 2025; shares are our calculation.
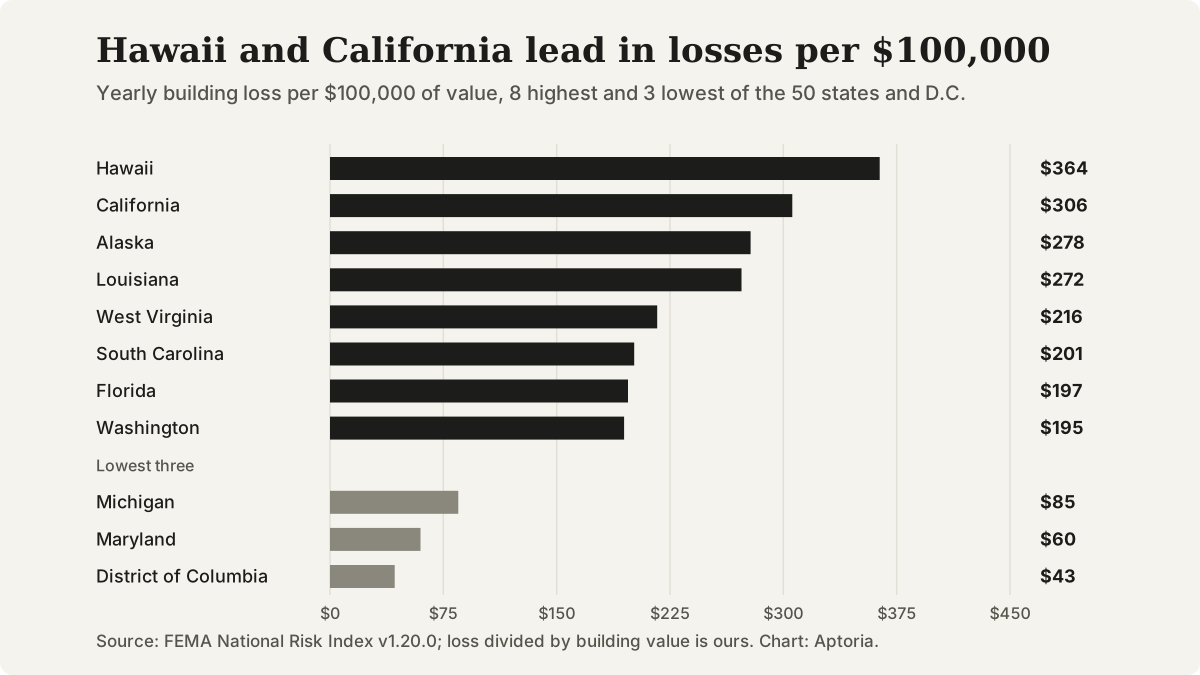
Expected annual building loss per $100,000 of building value, 8 highest and 3 lowest of the 50 states and D.C. Source: FEMA National Risk Index, version 1.20.0, December 2025; loss divided by building value is our calculation.
Questions that come up
Does this page say how likely a disaster is at my property?
No. The National Risk Index estimates average yearly losses for counties and Census tracts, and FEMA says it is meant for planning and broad comparisons, and not as a substitute for a localized risk assessment.
Why does California rank first in dollars but Hawaii first by loss rate?
Dollar totals depend on how much building value a state has. FEMA's loss rate is expressed as a yearly percentage loss, so a state with fewer buildings can rank higher. California has about 22% of expected building loss nationally; Hawaii's rate is the highest among the 50 states and D.C.
What counts as inland flooding?
FEMA's glossary defines it as streams and rivers overflowing their channels or heavy rain overwhelming drainage systems, and notes it can happen away from any river or lake.
Does this page use FEMA's Risk Index ratings?
No. The composite Risk Index adjusts expected losses for social vulnerability and community resilience, and FEMA does not publish it for states. This page reports expected annual loss to buildings only.
Sources and references
Follow each source to check the underlying claim. Access checks and professional review are different steps.