The short answer
About $35.8 trillion. In the second quarter of 2026, U.S. household real estate, mostly owner-occupied homes, was worth $49.8 trillion against $14.0 trillion of mortgages, so owners' equity was 71.9% of value, Federal Reserve data show. That is a record in dollars, not adjusted for inflation. The typical homeowner family had $230,000 in home equity in 2025.
Key takeaways
The key numbers
The Federal Reserve's Financial Accounts give the national total. In 2026 Q2, household real estate was worth $49.8 trillion at market value, households and nonprofit organizations owed $14.0 trillion on one-to-four-family mortgages, and the difference, owners' equity, was $35.8 trillion.
The Survey of Consumer Finances shows what that looks like for families, from interviews about their own homes and debts. It is a different source with a different date, so its figures describe a typical family rather than adding up to the national total.
| Measure | Value | Period | Source |
|---|---|---|---|
| Household real estate (mostly owner-occupied), market value | $49.8 trillion | 2026 Q2 | Z.1 table S1M.b |
| One-to-four-family mortgages owed | $14.0 trillion | 2026 Q2 | Z.1 table S1M.b; includes home equity lines |
| Owners' equity in household real estate | $35.8 trillion | 2026 Q2 | Z.1 table S1M.b |
| Owners' equity as a share of value | 71.9% | 2026 Q2 | Z.1 table S1M.b |
| Families owning their primary residence | 65.6% | 2025 survey | SCF |
| Median value of the primary residence, owners | $375,000 | 2025 survey | SCF |
| Median net housing value (value minus home-secured debt), owners | $230,000 | 2025 survey | SCF |
| Families with debt secured by their primary residence | 42.0% | 2025 survey | SCF |
| Median debt secured by the primary residence, families with such debt | $183,600 | 2025 survey | SCF |
| Families owning other residential property | 13.8% | 2025 survey | SCF; includes second homes and rentals |
| Median value of other residential property, owners of it | $280,000 | 2025 survey | SCF |
| Families with debt secured by other residential property | 4.4% | 2025 survey | SCF |
Is home equity at a record high?
In dollars, yes. Owners' equity of $35.8 trillion in 2026 Q2 is the highest in the Federal Reserve's series, up about 2% from $35.0 trillion a year earlier (our calculation). These are current dollars, not adjusted for inflation.
As a share of home values, equity is high but not at a peak. It was 71.9% in 2026 Q2, a little below 72.1% a year earlier and the 72.3% reached in 2024 Q2, which was the highest since 1959. The share has been at or near 70% since the start of 2022; before 2022, it had last been this high in early 1960.
Since the end of 2000, the value of household real estate has risen about 3.9-fold and mortgage debt about 2.9-fold (our calculations), which is why the equity share is higher now than it was then.
How much equity did homeowners lose in the housing bust?
About 43%. Owners' equity peaked at $14.4 trillion in 2005 Q4 and fell to $8.3 trillion in 2012 Q1, as home values dropped. Mortgage debt kept rising until it peaked at $10.7 trillion in 2008 Q1, and it was still higher in 2012 Q1 than in 2005 Q4.
The equity share fell from 61.8% to 46.0% over the same period, the lowest in the Fed's series, which begins in 1945. Equity passed its earlier peak in dollars again in 2016 Q2.
| End of year | Real estate value | One-to-four-family mortgages | Owners' equity | Equity share of value |
|---|---|---|---|---|
| 2000 | $12.8T | $4.8T | $8.0T | 62.6% |
| 2005 | $23.3T | $8.9T | $14.4T | 61.8% |
| 2007 | $23.3T | $10.6T | $12.7T | 54.5% |
| 2010 | $18.8T | $10.0T | $8.9T | 47.1% |
| 2012 | $18.5T | $9.5T | $9.0T | 48.6% |
| 2015 | $23.1T | $9.4T | $13.7T | 59.2% |
| 2020 | $32.3T | $10.8T | $21.5T | 66.6% |
| 2025 | $47.9T | $13.8T | $34.1T | 71.2% |
| 2026 Q2 | $49.8T | $14.0T | $35.8T | 71.9% |
How much equity does a typical homeowner have?
About $230,000 at the median in 2025, up from $218,900 in 2022 in 2025 dollars, according to the Survey of Consumer Finances. The survey defines net housing value as the home's value minus mortgages, home equity loans and home equity lines of credit secured by it, and the value is what respondents report their home is worth.
In the 2025 survey, 65.6% of families owned their primary residence, which the Fed describes as about unchanged from 66.1% in 2022. The median owner's home was worth $375,000. About 42% of all families had debt secured by their primary residence, with a median of $183,600 among them.
| Measure | 2022 | 2025 |
|---|---|---|
| Own primary residence | 66.1% | 65.6% |
| Median value, owners | $353,700 | $375,000 |
| Median net housing value, owners | $218,900 | $230,000 |
| Have debt secured by primary residence | 42.2% | 42.0% |
| Median of that debt, families with it | $170,200 | $183,600 |
| Own other residential property | 12.9% | 13.8% |
| Median value of other residential property, owners | $246,200 | $280,000 |
| Have debt secured by other residential property | 4.4% | 4.4% |
| Median of that debt, families with it | $133,500 | $148,600 |
Do these figures include rental property?
Mostly not. The Fed's household real estate covers owner-occupied homes of all types, plus second homes that are not rented, vacant homes for sale and vacant land, according to the table's notes. The Fed shows nonfinancial noncorporate businesses, which are often small businesses, as a separate sector from households.
That separate sector held $10.6 trillion of residential real estate in 2026 Q2. It is not part of the equity figures on this page, and this page does not estimate how much of it is equity or who owns it.
The Survey of Consumer Finances asks families about other residential property, which includes second homes, time shares, one- to four-family rental properties and other residential property, as well as loans the family made to finance the sale of property it previously owned. In 2025, 13.8% of families owned some, which the Fed describes as up slightly from 12.9% in 2022, with a median value of $280,000 among them. Because it mixes vacation homes and rentals, it is not a count of landlords.
Only 4.4% of families had debt secured by other residential property, with a median of $148,600. That share is much smaller than the share that owns such property, which suggests, by our reading, that many of these owners have no loan secured by it, though the survey's published tables do not let us match the two groups directly.
What this means for landlords
These are considerations to weigh, not financial, lending or investment advice.
- National equity totals describe household real estate, mostly owner-occupied homes, as a whole. The equity in your own home or rental depends on that property's value and loan balance, and a national figure does not tell you either.
- Equity is not cash. Borrowing against it, through a cash-out refinance or a home equity line, increases what you owe and changes your loan terms and payments. A break-even calculation can help you compare the costs; whether any option fits you is a question for you and a qualified professional.
- The values here are estimates: the Fed's are national market-value estimates, and the survey's are what owners report. A lender's appraisal of a specific property may come out differently.
- Rented property is mostly outside the Fed's household equity figure, so a rising national total does not by itself say anything about equity in rentals.
Methodology
National figures come from the Federal Reserve's Financial Accounts of the United States (Z.1) for 2026 Q2, released September 11, 2026. The Fed renumbered its tables in its June 11, 2026 release; the household balance sheet once known as table B.101 is now table S1M.b. We read the quarterly series from the Fed's full data package and checked the latest quarter against the published table.
Owners' equity is the Fed's own figure: household real estate at market value minus one-to-four-family residential mortgages owed by households and nonprofit organizations. We checked that the subtraction holds in every quarter since 2000. The mortgage line includes home equity lines of credit and junior-lien home equity loans, per the table's notes.
The Fed's release calendar lists the next Financial Accounts release for December 10, 2026; we plan to update this page after it.
Family figures come from the 2025 Survey of Consumer Finances report, dated October 9, 2026, and its historical tables based on the Fed's internal data, which match the figures printed in the report. Dollar amounts from the survey are in 2025 dollars, as the Fed reports them. Percentage changes, multiples and comparisons labeled as ours are our calculations, rounded once at display.
Source: Board of Governors of the Federal Reserve SystemSource: Board of Governors of the Federal Reserve SystemSource: Board of Governors of the Federal Reserve SystemSource: Board of Governors of the Federal Reserve SystemSource: Board of Governors of the Federal Reserve SystemSource: Board of Governors of the Federal Reserve SystemSource: Board of Governors of the Federal Reserve SystemSource: Board of Governors of the Federal Reserve System
Limitations
Keep these limits in mind.
- The Fed says all Financial Accounts data are subject to revision and that household figures are largely estimated as a residual from other sectors' data, so recent quarters can change in later releases.
- Z.1 figures are not adjusted for inflation. A record in dollars is not necessarily a record in purchasing power.
- The household mortgage line covers households and nonprofit organizations together, while the real estate line is households only; this follows the Fed's own calculation.
- The survey's home values are reported by respondents, and the Fed's report says it generally does not address the statistical significance of changes between surveys. This page repeats the Fed's descriptions, such as about unchanged, and does not run significance tests of its own.
- The survey's other residential property category includes second homes and time shares as well as rentals, and its rental-property debt figures cannot be tied to specific owners.
- This page does not forecast home equity or home prices.
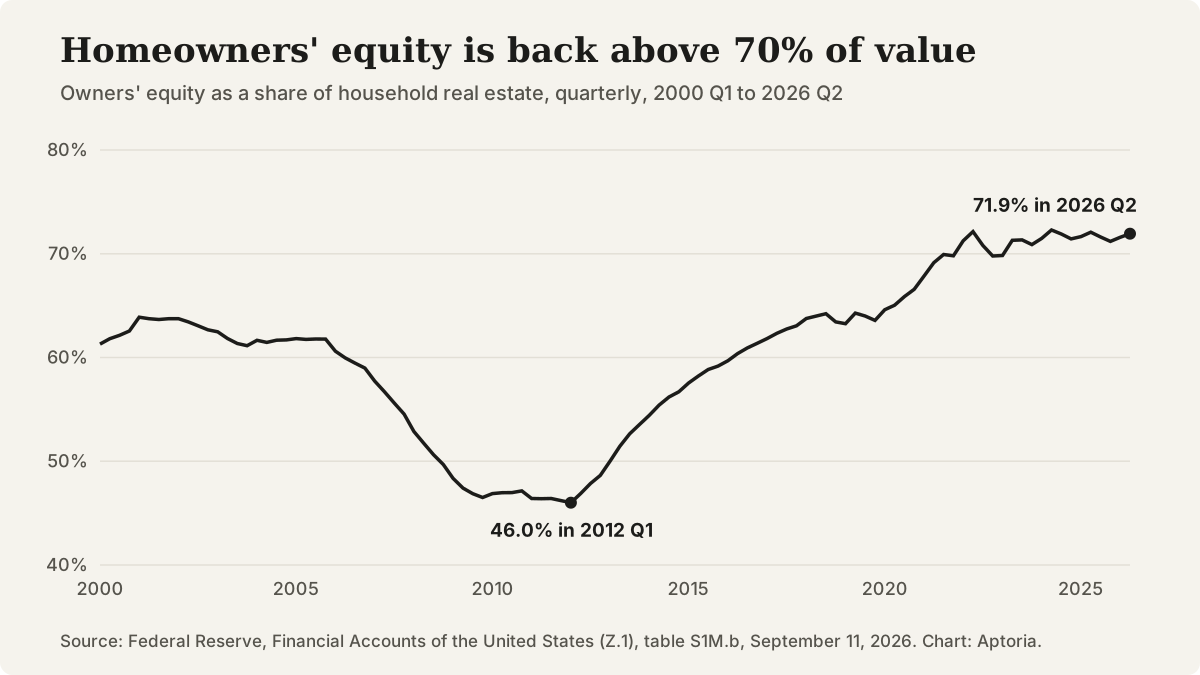
Owners' equity as a share of household real estate, quarterly, 2000 Q1 to 2026 Q2. Source: Federal Reserve, Financial Accounts of the United States, table S1M.b.
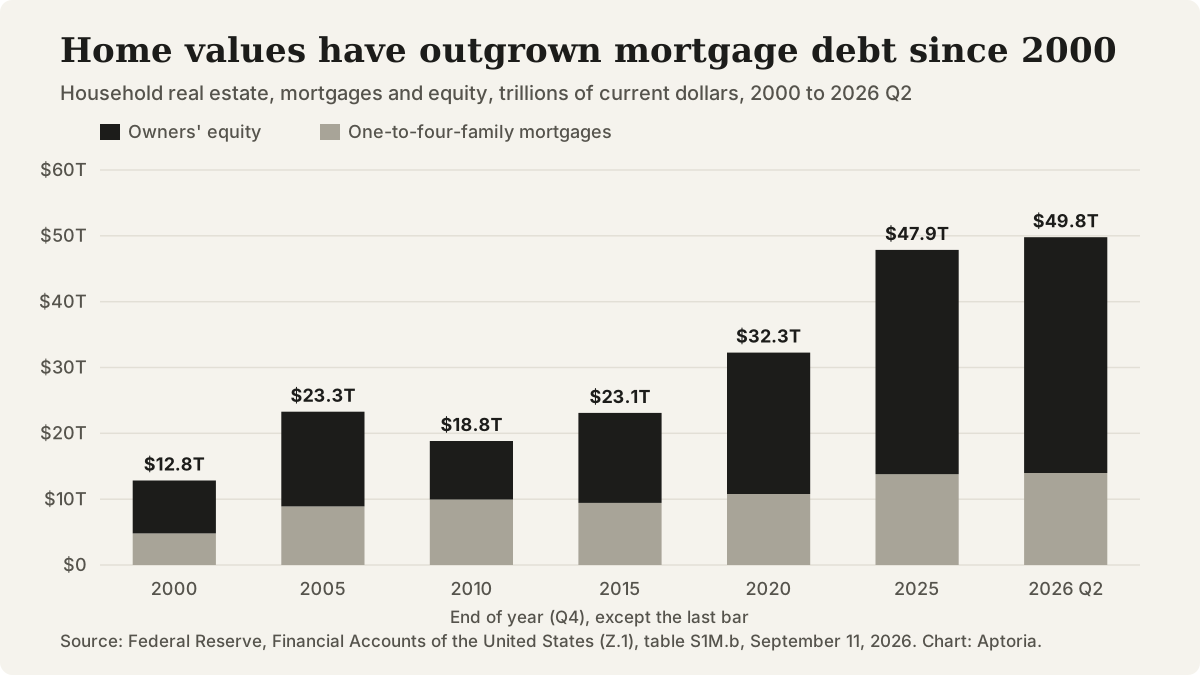
Household real estate value, one-to-four-family mortgages and owners' equity, trillions of current dollars, end of selected years and 2026 Q2. Source: Federal Reserve, Financial Accounts of the United States, table S1M.b.
Questions that come up
Does this page say whether I should refinance or open a home equity line?
No. It reports national figures. Whether borrowing against a property makes sense depends on your loan terms, income, plans and the property itself, which a lender, tax professional or financial adviser can help you weigh.
Why is the national equity share different from a typical owner's equity?
The Fed's share divides total equity by total value, so it is weighted toward higher-value homes. The survey's median describes the middle owner family. The two also come from different methods and dates, so they are not meant to match.
Does the Fed's mortgage figure include home equity lines of credit?
Yes. The notes to the Fed's household balance sheet say the one-to-four-family mortgage line includes loans made under home equity lines of credit and home equity loans secured by junior liens.
When will newer figures be available?
The Fed's release calendar lists the next Financial Accounts release, with third-quarter 2026 figures, for December 10, 2026. Releases usually come in the second week of March, June, September and December, though third-quarter 2025 figures came out in January 2026. The Survey of Consumer Finances is normally conducted every three years.
Sources and references
Follow each source to check the underlying claim. Access checks and professional review are different steps.