The short answer
About 4.0 million. EPA's 2025 update projects 3,956,383 lead and galvanized requiring replacement service lines, from water systems' inventories. They are concentrated in the Midwest and Northeast, our reading of EPA's state figures: Illinois has the most, 631,642, and five states hold 50% of the total. A 2024 rule, being challenged in court, requires water systems to replace those under their control within 10 years after November 1, 2027.
Key takeaways
The key numbers
A service line is the pipe that carries water from the main in the street into a building. EPA's latest count, released in September 2025 and described in a November 2025 fact sheet, projects 3,956,383 lines that are lead or galvanized requiring replacement (GRR), out of about 103 million service lines in the states and territories.
EPA says about 3 million of these were reported as lead or GRR by water systems, and about 1 million are lines reported as unknown material that EPA predicts are lead. Lead lines are 2.66 million of the total and GRR lines 1.30 million.
| Measure | Count | Note |
|---|---|---|
| Projected lead and GRR service lines | 3,956,383 | EPA rounds this to 4 million |
| Of which lead | 2,659,983 | Lead pipe, or partly lead |
| Of which galvanized requiring replacement | 1,296,400 | About 33% of the total (our calculation) |
| All projected service lines | 102,958,322 | Lead and GRR are 3.8% of these (our calculation) |
| Share in the five states with the most | 50.1% | Illinois, Ohio, New York, Michigan and Pennsylvania (our calculation) |
Which states have the most lead service lines?
Illinois has the most by a wide margin, 631,642, followed by Ohio (406,565) and New York (383,390). Together with Michigan and Pennsylvania, those five states account for 50.1% of the national total, and the top 10 for 73.4%, our calculation. 11 states have more than 100,000.
As a share of all service lines, Illinois is also highest at 16.5%, followed by the District of Columbia (13.8%), Wisconsin (13.5%) and Rhode Island (13.3%), our calculation. Florida and California have many service lines but few lead or GRR ones: 0.7% of Florida's and 0.1% of California's.
The mix differs by state. In Texas, 137,872 of its 143,988 projected lines (96%) are galvanized requiring replacement rather than lead. Four states have fewer than 1,000 projected lead and GRR lines in EPA's file: Hawaii, New Mexico, Oregon and Alaska.
| State | Lead and GRR lines | Of which lead | Of which GRR | Share of all service lines |
|---|---|---|---|---|
| Illinois | 631,642 | 561,532 | 70,110 | 16.5% |
| Ohio | 406,565 | 337,371 | 69,194 | 11.1% |
| New York | 383,390 | 333,779 | 49,611 | 10.1% |
| Michigan | 294,388 | 230,346 | 64,042 | 11.1% |
| Pennsylvania | 264,961 | 167,306 | 97,655 | 6.7% |
| Indiana | 261,897 | 230,380 | 31,517 | 12.5% |
| New Jersey | 206,711 | 103,092 | 103,619 | 8.2% |
| Wisconsin | 193,389 | 179,636 | 13,753 | 13.5% |
| Texas | 143,988 | 6,116 | 137,872 | 1.5% |
| Missouri | 117,273 | 53,871 | 63,402 | 5.3% |
| Minnesota | 108,200 | 86,742 | 21,458 | 7.2% |
| Kansas | 97,421 | 21,490 | 75,931 | 10.3% |
Why did EPA's estimate go from 9 million to 4 million?
Earlier editions were built differently. The April 2023 survey projected 9,223,745 lead service lines from a 2021 questionnaire sent to a statistical sample of water systems, and a May 2024 update to that questionnaire projected about 9.0 million. In 2025, EPA switched to the initial inventories water systems had to prepare under the 2021 Lead and Copper Rule Revisions, which it calls the best available national and state information.
The categories also differ. The 2023 and 2024 lead estimates already included galvanized lines that had been downstream of lead; only galvanized lines never downstream of lead were counted separately. The 2025 estimate counts lead and GRR lines. EPA says the 2025 update uses the inventories because they are the best available information, and its January 2025 allotment memo says the switch was also partly a response to an EPA Inspector General report that found flaws in the earlier questionnaire data. EPA does not say how much of the difference, if any, reflects lines already replaced, so this page treats the editions as different estimates rather than a trend.
| Edition | Lead estimate | Galvanized lines | Based on |
|---|---|---|---|
| 7th DWINSA, April 2023 | 9,223,745 lead content | 2,800,839 never downstream of lead, counted separately | 2021 questionnaire to a sample of water systems |
| Updated 7th DWINSA, May 2024 | about 9.0 million lead content | about 2.9 million never downstream of lead, counted separately | 2023 update to the questionnaire |
| 2025 update | 3,956,383 lead and GRR | GRR lines included in the estimate | Water systems' initial inventories, reported in 2025 |
What does the federal rule require of water systems?
EPA's Lead and Copper Rule Improvements (LCRI) were published on October 30, 2024 and took effect on December 30, 2024; most requirements apply from November 1, 2027. The rule requires community and certain other water systems to replace lead and GRR service lines under their control no later than 10 years after that compliance date, with limited extra time for some systems. It also lowers the lead action level from 0.015 to 0.010 milligrams per liter.
Water systems had to submit an initial service line inventory to their state by October 16, 2024 and must submit an updated baseline inventory by the 2027 compliance date. The inventory covers every service line connected to the system regardless of who owns it, and EPA says systems must make inventories and replacement plans available to the public.
Whether a water system can get access to replace the part of a line on private property is decided by state or local law or the system's tariff, not by the federal rule. Where the system can get access only with the property owner's consent, the rule requires a reasonable effort of at least four attempts, using at least two methods of communication, before the replacement deadline; states can require more. If the owner does not consent, the system does not have to replace the line unless the property changes hands. In that case it must offer replacement to the new owner within six months and seek consent again within a year.
Legal status: the American Water Works Association has asked the U.S. Court of Appeals for the D.C. Circuit to review the rule (American Water Works Association v. EPA, No. 24-1376, filed December 13, 2024). At EPA's request the case was paused from February to August 2025 while new agency leadership reviewed the rule. EPA then defended it, asking the court in a February 2026 brief to uphold the rule, and the court heard oral argument on September 30, 2026. As of October 24, 2026 we found no decision, no Federal Register notice proposing to change or delay the rule, and no change to its eCFR text since December 30, 2024. The court's decision, when it comes, could change the rule's requirements or deadlines.
Source: Federal Register (EPA)Source: U.S. Environmental Protection AgencySource: U.S. Environmental Protection AgencySource: U.S. Environmental Protection AgencySource: Electronic Code of Federal RegulationsSource: U.S. Court of Appeals for the D.C. Circuit (docket via CourtListener)Source: U.S. Court of Appeals for the D.C. Circuit (filing)Source: U.S. Court of Appeals for the D.C. Circuit (filing)Source: U.S. Court of Appeals for the D.C. Circuit (filing)
What this means for landlords
These are considerations, not legal advice. This page does not say whether a particular building has a lead line or what any law requires of you as an owner.
- Look up each property in your water system's service line inventory, which EPA says systems must make available to the public. If a line is listed as unknown, the system has not yet identified its material.
- If a utility asks for consent to replace the private-side portion of a line at a property you own, ask what the work involves, what it costs you, if anything, and how long the offer stands. Under the federal rule, a system that has made at least four attempts by two methods without getting consent does not have to replace the line unless ownership changes, and must then offer replacement to the new owner.
- Who pays for the private-side portion varies by water system, state and local program. EPA says Congress gave the Drinking Water State Revolving Fund $15 billion for lead service line replacement, so it may be worth asking whether your utility's program covers it. EPA's August 2026 Access Tips guidance says that where owners are required to pay and do not agree, the system is not required to replace the line.
- Tenants may receive notices from the water system about a known or potential lead line. Pointing them to the utility and to EPA's Protect Your Tap guide is one option; EPA's lead in drinking water page covers health questions.
- Lead in water lines is a separate issue from lead-based paint, which the age and condition of rental housing page covers.
Methodology
State counts are EPA's projections from its 2025 update to the 7th Drinking Water Infrastructure Needs Survey and Assessment (DWINSA), downloaded on October 24, 2026. EPA built them from community water systems' inventories, which states reported by March 31, 2025 and could update until June 30, 2025.
EPA made two adjustments for gaps: where a state reported no inventory data for a system, EPA assumed all of its connections were non-lead, and where non-lead counts were missing it estimated them from total connections. For lines of unknown material, EPA applied each state's ratio of lead and GRR lines to all lines of known material.
Shares of service lines, state ranks and the concentration figures are our calculations from EPA's file, rounded once at display. Rule requirements come from the Federal Register text of the LCRI; the eCFR version history and the D.C. Circuit docket were checked on October 24, 2026.
Limitations
Keep these limits in mind.
- These are projections, not a pipe-by-pipe count. By EPA's rounded figures, about 1 million of the 4 million are lines of unknown material that EPA predicts are lead, using a state-wide ratio that may not match any one water system.
- Where a state reported no inventory data for a system, EPA counted that system's lines as non-lead, so states with incomplete reporting could be undercounted. EPA's page notes its projections differ from reported inventories in a few cases.
- The projections use inventories from community water systems eligible for state revolving fund money, according to EPA's fact sheet. Homes on private wells are not served by public water systems, so they are not counted.
- Inventories change as water systems identify unknown lines and replace lead ones, so a state's figure can move between updates.
- The legal summary reflects the rule text and the court docket as checked on October 24, 2026, when the D.C. Circuit had heard argument but not ruled. It is not legal advice, and state and local rules on access, consent and cost vary.
- This page does not give health advice; EPA's pages linked here cover lead exposure.
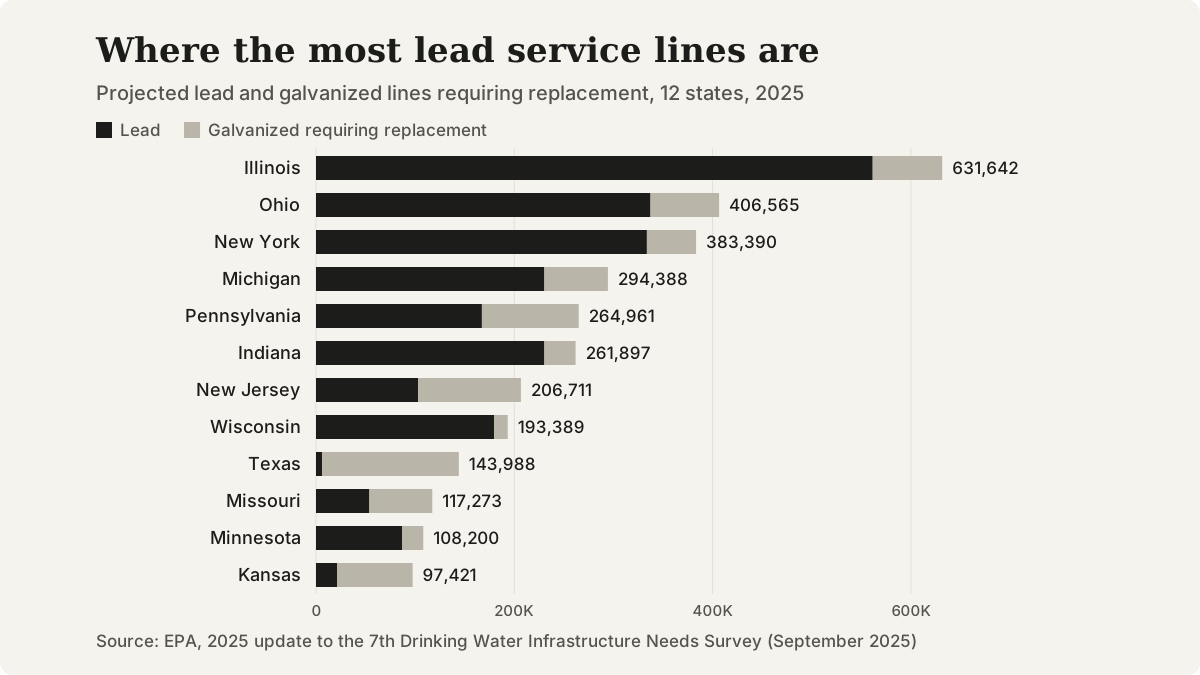
Projected lead and galvanized requiring replacement service lines, 12 states with the most, 2025. Source: EPA, 2025 update to the 7th DWINSA.
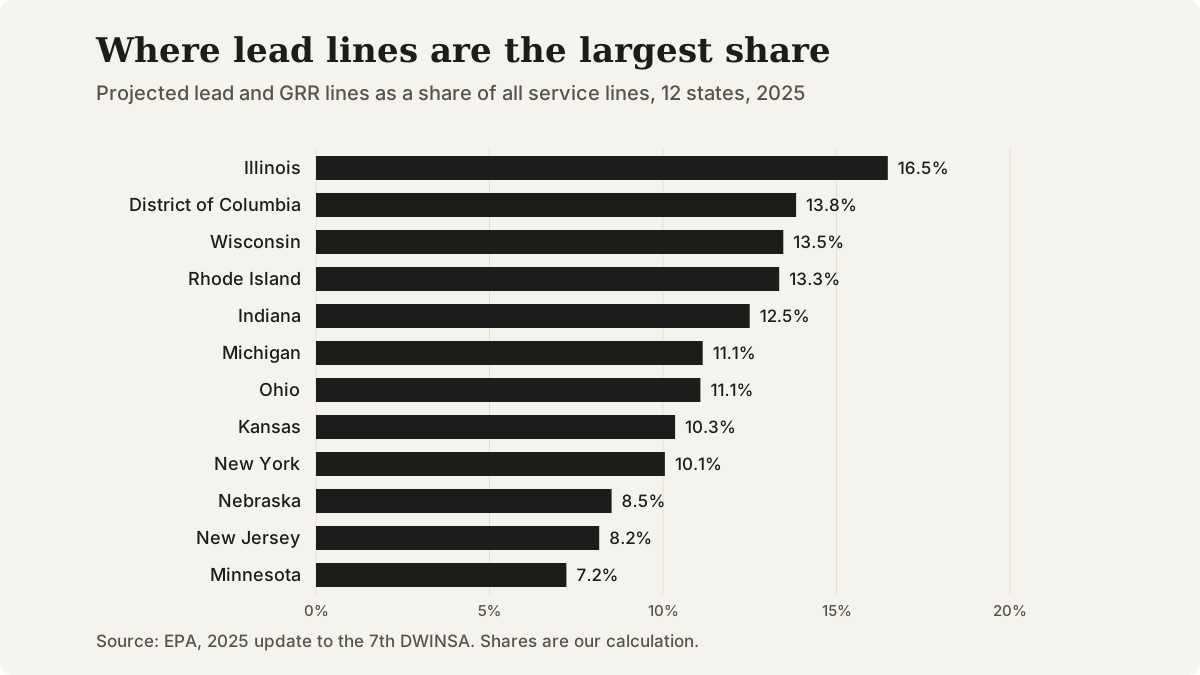
Projected lead and GRR lines as a share of all service lines, 12 states, 2025. Our calculation from EPA's 2025 update to the 7th DWINSA.
Questions that come up
Does this page show whether my building has a lead service line?
No. It reports EPA's state and national projections. Your water system's service line inventory is the place to look up an address, and EPA's Protect Your Tap guide explains how to check the pipe where it enters a building.
What is a galvanized requiring replacement line?
Under the federal rule, it is a galvanized steel service line that is or ever was downstream of a lead line, or is downstream of a line whose material is unknown. If a water system cannot show a galvanized line was never downstream of lead, it is treated as GRR.
Are lead connectors counted in these numbers?
No. Under the rule, a connector (also called a gooseneck or pigtail) is a bendable pipe no more than three feet long, typically joining the service line to the main, and lead connectors are not part of the service line. Water systems must track them in their inventories and replace them when they come across them during water system infrastructure work, where the connector is under the system's control.
When will the numbers be updated?
EPA had not announced a date for its next update in the sources used here. It has started the 8th needs survey, proposing the information collection in December 2024 and sending it for federal approval in June 2026, and water systems must submit updated baseline inventories to their states by November 1, 2027.
Sources and references
Follow each source to check the underlying claim. Access checks and professional review are different steps.