The short answer
Yes, and they have in most months since 2017. Zillow's typical single-family rent rose 3.2% in the year to September 2026, against 2.4% for multifamily units. Since February 2017, apartments grew faster only from September 2021 to August 2022. Since September 2019, single-family rents are up 48.8% and apartment rents 31.1%.
Key takeaways
The key numbers
These are Zillow's typical rents for the U.S. in September 2026, seasonally adjusted. The single-family and multifamily figures come from Zillow's separate index files for each housing type.
| Measure | Single-family homes | Multifamily units | All home types |
|---|---|---|---|
| Typical rent, September 2026 | $2,266 | $1,762 | $1,932 |
| Typical rent, September 2025 | $2,195 | $1,720 | $1,878 |
| Typical rent, September 2019 | $1,523 | $1,345 | $1,381 |
| Change over the past year | +3.2% | +2.4% | +2.9% |
| Change since September 2019 | +48.8% | +31.1% | +39.9% |
How much faster are single-family rents rising?
Somewhat faster this year, and much faster over several years. Over the year to September 2026, single-family rents rose 3.2% and multifamily rents 2.4%, a gap of 0.8 points. The not seasonally adjusted versions of the same files show the same order (3.1% against 2.2%).
The exception was the 2021–2022 surge. Single-family growth led from February 2017 to August 2021, then apartment growth was higher from September 2021 to August 2022 and peaked higher, at 16.1% in January 2022, while single-family growth peaked at 12.9% in March 2022. Apartment growth then slowed more, reaching a low of 1.0% in March 2026. Single-family growth has been the higher of the two in each of the 49 months since September 2022, starting with a lead of just 0.06 points that month.
Over the longer run the gap is wide. Since September 2019, single-family rents are up 48.8% and multifamily rents 31.1%, a difference of 17.7 points.
How big is the difference in dollars?
Zillow's typical single-family rent was $2,266 a month in September 2026, against $1,762 for multifamily units, or 28.6% more. In September 2019 the difference was 13.2%.
The two files describe different sets of homes, so this is not the price of the same unit in two settings. It shows how the typical rent in each segment has moved apart.
Where is the gap largest?
Zillow's files cover 49 of the metros it ranks 1 to 50 by size (its ranking skips 33). Comparing the rounded figures, single-family rent growth was higher in 37 of them over the year to September 2026, apartment growth was higher in 9, and 3 were tied. Single-family rents rose in all 49 (by at least 0.6%), while multifamily rents fell in 6.
The largest single-family leads were in Salt Lake City, UT, Charlotte, NC and Columbus, OH. Apartments rose faster in 9 of 49, most of all in San Francisco, CA, where multifamily rents were up 12.7%.
| Metro | Single-family | Multifamily | Gap (points) |
|---|---|---|---|
| Salt Lake City, UT | +3.4% | −0.2% | +3.6 |
| Charlotte, NC | +3.3% | +0.4% | +2.9 |
| Columbus, OH | +4.9% | +2.3% | +2.6 |
| Las Vegas, NV | +2.3% | −0.2% | +2.5 |
| Denver, CO | +1.6% | −0.8% | +2.4 |
| San Francisco, CA | +6.7% | +12.7% | −6.0 |
| Virginia Beach, VA | +5.3% | +8.1% | −2.8 |
| San Jose, CA | +7.4% | +8.9% | −1.5 |
| Chicago, IL | +4.2% | +4.9% | −0.7 |
| New Orleans, LA | +1.2% | +1.9% | −0.7 |
How much new rental supply is in each segment?
Zillow's files do not say why the two segments moved apart, and this page does not claim a cause. For context, Census construction data show far more new rental units arriving in apartment buildings than in houses: in 2025 about 461,000 rental units in buildings with two or more units were completed, against about 104,000 single-family homes built for rent (a figure derived from Census tables).
Our build-to-rent page explains how that single-family figure is derived and its margins.
What this means for landlords
These are considerations to weigh against your own market, not recommendations.
- Owners of single-family rentals: national single-family rents are still rising faster than apartment rents, but the metro table shows how much this varies. Comparable houses near yours are the better guide than any national figure.
- Owners of small multifamily buildings: apartment rent measures are the closer comparison for your units. They rose 2.4% nationally and fell in 6 large metros over the past year.
- Renewals: a faster-rising segment can make a renewal increase easier to justify against local alternatives, but a vacancy and turnover still carry real costs. Weigh both, and check state and local rules: some states and cities limit rent increases or set notice periods.
- Pricing data: build your asking rent from current public listings and recent leases nearby. A national index describes the market, not your unit.
Methodology
We download Zillow's public single-family and multifamily rent index files, both smoothed and seasonally adjusted, plus the all-homes file. We compute every change from the index levels and round once at the end. Gaps between the two segments are the difference of the displayed figures, so the tables add up.
The streak counts consecutive months, ending in September 2026, in which the single-family year-over-year change was higher than the multifamily one. Metro comparisons use every metro Zillow ranks 1 to 50 that appears in both files, and compare the rounded figures shown, counting ties separately.
Our housing market page shows 2.7% over the year for Zillow's all-homes index because it uses the not seasonally adjusted file; this page uses the seasonally adjusted file (2.9%), so the figures differ slightly.
Supply context comes from the Census data used on our build-to-rent page. We plan to refresh this page monthly after Zillow's release.
Limitations
Read the comparison with these limits in mind.
- Zillow's methodology pages could not be opened from our research environment, so the segments are described from the labels on its data files (single-family residence, multifamily, smoothed, seasonally adjusted). We could not confirm how condos are treated in the two split files.
- Zillow does not publish margins of error for these indexes, so small differences between segments or metros may not be meaningful.
- In both files the latest month's seasonally adjusted value equals the unadjusted value, so September 2026 may be revised when Zillow updates its adjustment.
- National and metro figures hide neighborhood and unit-level differences.
- All figures are nominal, not adjusted for inflation. This page does not forecast rents.
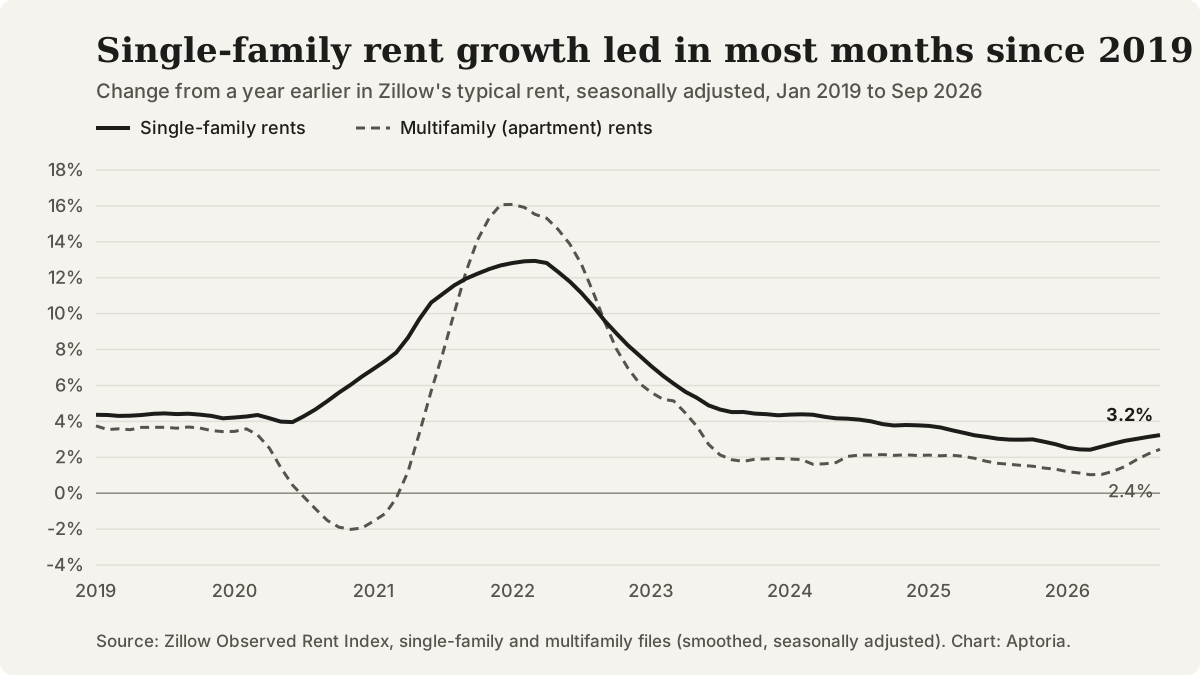
Year-over-year change in Zillow's typical single-family and multifamily rent, seasonally adjusted, January 2019 to September 2026. Source: Zillow Observed Rent Index.
Questions that come up
What does Zillow count as multifamily?
We could not open Zillow's methodology pages, so we describe the series from its file labels: one file covers single-family residences and the other multifamily units. Check Zillow's own documentation for exact definitions.
Is this the same as the government's rent inflation figure?
No. This page uses Zillow's rent indexes only. Our housing market page explains how the Consumer Price Index measures rent and why it moves differently.
How often is this page updated?
We plan a monthly refresh after Zillow publishes new rent index files. The updated date and revision history show when figures last changed.
Should I raise my rent because single-family rents are rising faster?
Not on the strength of a national number. Compare current listings and recent leases for similar homes near yours, weigh the cost of a vacancy, and check your state and local rules, since some places limit rent increases or set notice periods.
Sources and references
Follow each source to check the underlying claim. Access checks and professional review are different steps.