The short answer
Relative to population, the most new housing in 2025 was permitted in Southern and Mountain states. Idaho led with 8.8 units authorized per 1,000 residents, against 4.2 nationally, and Raleigh-Cary, NC and Austin-Round Rock-San Marcos, TX led large metros. In January–September 2026, Census's national figures show total permits down 0.5% from a year earlier and permits for units in buildings with five or more units up 5.1%.
Key takeaways
The national picture
Permits authorized 1,431,616 housing units in 2025, about 4.2 for every 1,000 residents. 63.7% were in single-family buildings and 32.4% in buildings with five or more units.
So far in 2026 the national total is close to last year's: Census's release shows 1.083 million units authorized in January through September, −0.5% from a year earlier. The mix shifted, with single-family units −2.8% and units in 5+ unit buildings +5.1%.
| Measure | Value | Period |
|---|---|---|
| Units authorized | 1,431,616 | 2025 |
| Units per 1,000 residents | 4.2 | 2025 (July 1, 2025 population) |
| Share in single-family (1-unit) buildings | 63.7% | 2025 |
| Share in buildings with 5+ units | 32.4% | 2025 |
| Units authorized, January–September | 1.083 million vs 1.089 million | 2026 vs 2025, national release |
| All units, January–September | −0.5% | 2026 vs 2025, national release |
| Single-family units, January–September | −2.8% | 2026 vs 2025, national release |
| Units in 5+ unit buildings, January–September | +5.1% | 2026 vs 2025, national release |
Which states permit the most housing per resident?
Idaho (8.8 per 1,000 residents), South Carolina (8.2), North Carolina (7.7), Florida (7.6) and Utah (7.6) had the highest rates in 2025. Seven states were below 2.0 per 1,000: Alaska (1.15), Illinois (1.46), Rhode Island (1.56), Massachusetts (1.74), New York (1.93), Pennsylvania (1.97) and Connecticut (1.97).
20 states had a rate above the national figure. By raw count the largest totals were in Texas, Florida and California, which are also among the most populous states.
Through August 2026, the latest month of state detail, 27 states (counting the District of Columbia) had more units authorized than in the same months of 2025 and 24 had fewer.
| State | All units | Single-family | 5+ unit buildings | Jan–Aug change |
|---|---|---|---|---|
| Idaho | 8.8 | 7.0 | 1.4 | +5.7% |
| South Carolina | 8.2 | 7.2 | 0.9 | +5.1% |
| North Carolina | 7.7 | 5.8 | 1.7 | +5.1% |
| Florida | 7.6 | 4.7 | 2.7 | −11.2% |
| Utah | 7.6 | 4.7 | 2.6 | −5.9% |
| New York | 1.9 | 0.6 | 1.3 | +46.1% |
| Massachusetts | 1.7 | 0.7 | 1.0 | +26.8% |
| Rhode Island | 1.6 | 0.7 | 0.5 | +42.4% |
| Illinois | 1.5 | 0.9 | 0.5 | +4.1% |
| Alaska | 1.2 | 0.8 | 0.2 | −8.3% |
Which large metros permit the most housing?
Among the 56 metro areas with at least 1 million residents, Raleigh-Cary, NC (11.0 per 1,000) and Austin-Round Rock-San Marcos, TX (10.4) authorized the most housing relative to population in 2025, followed by Orlando-Kissimmee-Sanford, FL, Nashville-Davidson--Murfreesboro--Franklin, TN and Houston-Pasadena-The Woodlands, TX.
The lowest rates were in Hartford-West Hartford-East Hartford, CT and Buffalo-Cheektowaga, NY (about 1.3 per 1,000), followed by Rochester, NY, Chicago-Naperville-Elgin, IL-IN and San Francisco-Oakland-Fremont, CA.
Together these large metros hold 57.1% of the U.S. population and accounted for 55.8% of all units authorized in 2025, but 67.8% of units in 5+ unit buildings.
| Metro | All units | 5+ unit buildings | Jan–Aug change, all units |
|---|---|---|---|
| Raleigh-Cary, NC | 11.0 | 3.5 | +6.2% |
| Austin-Round Rock-San Marcos, TX | 10.4 | 4.5 | −13.6% |
| Orlando-Kissimmee-Sanford, FL | 9.4 | 4.6 | −33.1% |
| Nashville-Davidson--Murfreesboro--Franklin, TN | 8.7 | 2.7 | −15.3% |
| Houston-Pasadena-The Woodlands, TX | 8.2 | 2.1 | −11.2% |
| Greenville-Anderson-Greer, SC | 8.1 | 0.7 | +1.1% |
| Dallas-Fort Worth-Arlington, TX | 7.8 | 2.9 | −6.7% |
| Phoenix-Mesa-Chandler, AZ | 7.6 | 2.8 | −9.0% |
| Charlotte-Concord-Gastonia, NC-SC | 7.6 | 2.0 | −15.4% |
| Jacksonville, FL | 7.5 | 2.1 | −10.0% |
| San Francisco-Oakland-Fremont, CA | 1.7 | 1.1 | +26.9% |
| Chicago-Naperville-Elgin, IL-IN | 1.7 | 0.6 | −6.5% |
| Rochester, NY | 1.7 | 0.4 | +3.6% |
| Buffalo-Cheektowaga, NY | 1.3 | 0.4 | +10.4% |
| Hartford-West Hartford-East Hartford, CT | 1.3 | 0.8 | +51.9% |
Where are permits for buildings with 5+ units highest relative to population?
Nationally, 1.4 units in buildings with five or more units were authorized per 1,000 residents in 2025. Among states, Florida (2.7), Utah (2.6) and Colorado (2.6) were highest.
Among large metros, Orlando-Kissimmee-Sanford, FL (4.6), Austin-Round Rock-San Marcos, TX (4.5) and Columbus, OH (4.3) led, and 25 of the 56 were above the national rate. The lowest included Memphis, TN-MS-AR (0.1) and Fresno, CA (0.2).
The permit data do not record whether units will be rented or sold, and Census classifies condominium apartment buildings with other structures of five units or more. So these figures include future condos as well as rental apartments.
Are permits for 5+ unit buildings rising or falling this year?
Nationally they are up, but it depends on the metro. Of the 10 large metros with the highest 2025 rates of 5+ unit permits, 6 had fewer units authorized in such buildings in January–August 2026 than a year earlier, including Orlando-Kissimmee-Sanford, FL (−56.3%) and Austin-Round Rock-San Marcos, TX (−32.5%).
Other large metros moved the other way. Among the 41 large metros with at least 1,000 such units in January–August 2025, the largest increases were in Seattle-Tacoma-Bellevue, WA (+133.3%), Cincinnati, OH-KY-IN and Indianapolis-Carmel-Greenwood, IN.
Year-to-date figures cover eight months and can swing widely from one year to the next, as the table shows. Census does not publish margins of error for these figures, so read large percentage moves on modest totals with care.
| Metro | Jan–Aug 2025 | Jan–Aug 2026 | Change |
|---|---|---|---|
| Seattle-Tacoma-Bellevue, WA | 3,820 | 8,911 | +133.3% |
| Cincinnati, OH-KY-IN | 1,306 | 2,884 | +120.8% |
| Indianapolis-Carmel-Greenwood, IN | 1,183 | 2,422 | +104.7% |
| Los Angeles-Long Beach-Anaheim, CA | 7,597 | 15,049 | +98.1% |
| Washington-Arlington-Alexandria, DC-VA-MD-WV | 5,755 | 10,187 | +77.0% |
| Oklahoma City, OK | 1,112 | 358 | −67.8% |
| Orlando-Kissimmee-Sanford, FL | 9,437 | 4,127 | −56.3% |
| Riverside-San Bernardino-Ontario, CA | 4,228 | 1,851 | −56.2% |
| Las Vegas-Henderson-North Las Vegas, NV | 2,496 | 1,127 | −54.8% |
| Louisville/Jefferson County, KY-IN | 1,989 | 1,098 | −44.8% |
Does a permit mean a new home is coming?
A permit is an authorization, not a building. Census counts a start when excavation begins for the foundation and a completion later, and it publishes a separate series for units authorized but not yet started. Our apartments-under-construction page follows those later stages.
Permits also do not record whether a home will be sold or rented. Census's Survey of Construction classifies new homes by purpose, such as built for rent, which our build-to-rent page covers for single-family homes.
What this means for landlords
These are considerations to weigh against your own market, not recommendations.
- Permits run ahead of new supply. A metro with a high rate of permits for 5+ unit buildings relative to population may see more new buildings competing for tenants once those projects finish, if they go ahead.
- A drop in permits this year does not remove units already under construction. Check the local pipeline before assuming competition will ease soon.
- Single-family permits matter if you rent out houses, since some new single-family homes are built to rent. Compare local listings, not only national rates.
- Per-capita rates help compare places of different sizes. For a specific neighborhood, county or city permit data and current listings tell you more.
Methodology
We use the Census Bureau's Building Permits Survey text files for states and core-based statistical areas: the 2025 annual files and the January–August year-to-date files for 2025 and 2026. Figures are the "estimates with imputation" series, which Census describes as reported data plus imputed activity for places that did not report.
Rates per 1,000 residents divide units authorized by Census's Vintage 2025 population estimate for July 1, 2025. Large metros are the 56 metropolitan statistical areas with at least 1 million residents in that estimate. Units in 2-unit and 3–4 unit buildings are included in totals but not shown separately. Census collects permit data for Puerto Rico and U.S. territories but excludes them from national estimates, so Puerto Rico and the San Juan metro area are excluded here too. All values are computed from unrounded data and rounded once.
U.S. year-to-date figures come from Census's national release, which says its year-to-date estimates reflect revisions not distributed to months. Adding up the state detail instead gives +0.05% for all units and +6.5% for 5+ unit buildings. That differs from the national +5.1% for two reasons: the state detail covers January–August while the national figure covers January–September, and state monthly figures are not revised while the national year-to-date total includes revisions.
We plan to refresh this page after Census releases state and metro detail for September 2026, scheduled for October 27, 2026, and again after the annual 2026 data in May 2027.
Limitations
Keep these limits in mind.
- Since January 2022 Census has built monthly permit estimates from its full list of permit offices rather than a probability sample, so it publishes no sampling error or margins of error for them.
- Places with little permit activity, about 1% of the total according to Census, are surveyed only annually, and missing reports are imputed. Monthly state and metro figures are not revised; only U.S. and regional totals are benchmarked after the annual survey.
- Census says over 99% of privately owned residential buildings are constructed in permit-issuing places, but areas without permit requirements are not covered, and that share varies by state and metro.
- Census updates its list of permit-issuing places each January and says this keeps the data comparable over time without adjusting for changes in permit coverage.
- State and metro year-to-date comparisons cover January through August; national year-to-date figures cover January through September. Population estimates are for July 1, 2025 and are revised each year.
- Permit counts are not starts or completions, and 5+ unit permits include future condominiums as well as rentals. This page does not forecast construction.
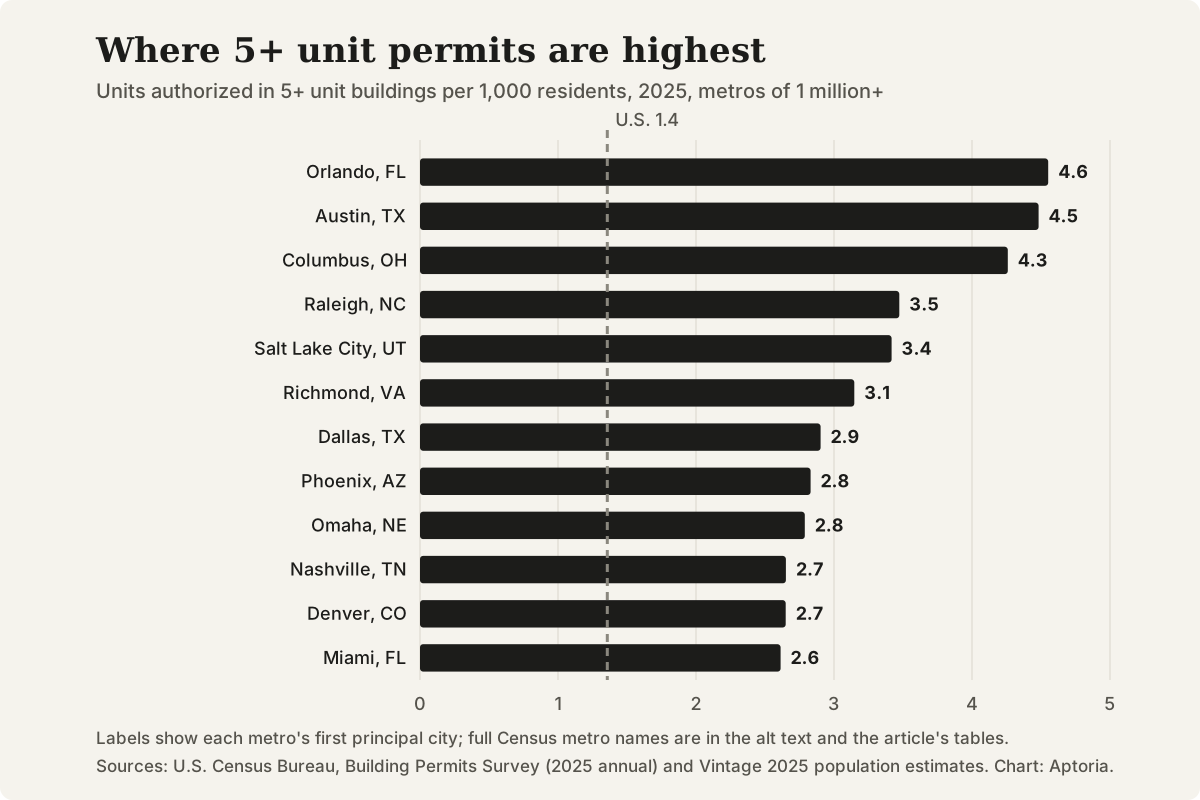
Units authorized in buildings with five or more units per 1,000 residents, 2025, for the 12 highest large metros, with the U.S. rate. Sources: Census Building Permits Survey and Vintage 2025 population estimates.
Questions that come up
What does a building permit count here?
The files report, for each state and metro, the number of buildings and housing units that local governments authorized through building or zoning permits, by building size. A house counts as one unit and a 100-unit apartment building as 100 units.
Why compare permits per 1,000 residents?
Large states and metros issue more permits simply because they are big. Dividing by population shows how much new housing is planned relative to the number of people already there.
Are these numbers final?
The 2025 figures are Census's annual totals. National 2026 figures run through September; state and metro detail runs through August. Census releases state and metro detail about a week after the national monthly report and does not revise monthly state and metro figures later.
Where can I see permits for my own city or county?
Census publishes the same survey for counties and individual permit-issuing places. Your local building department may also post permit records with more detail.
Sources and references
Follow each source to check the underlying claim. Access checks and professional review are different steps.