The short answer
Federal data show construction hiring has cooled since 2022 rather than tightened. The construction job openings rate averaged 2.8% in 2025, down from 4.9% in 2022, and was 2.9% in August 2026. Total construction employment is at a record, but residential trade contractors have about 3% fewer jobs than in September 2024.
Key takeaways
The key numbers
The Bureau of Labor Statistics does not publish a single shortage measure. These are the measures it does publish that bear on whether contractors are hard to find: job openings, hiring, quits, employment and pay.
| Measure | Latest | Earlier comparison | Source |
|---|---|---|---|
| Job openings rate, August 2026 (seasonally adjusted, preliminary) | 2.9% | 2.5% in August 2025 | JOLTS |
| Job openings rate, annual average | 2.8% in 2025 | 4.9% in 2022 | JOLTS |
| Hires rate, annual average | 4.0% in 2025 | 5.5% in 2019 | JOLTS |
| Quits rate, annual average | 1.8% in 2025 | 2.4% in 2022 | JOLTS |
| Construction employment, September 2026 | 8.36 million | 8.26 million a year earlier | CES |
| Residential specialty trade contractors, September 2026 | 2.34 million | 2.42 million in September 2024 | CES |
| Nonresidential specialty trade contractors, September 2026 | 2.94 million | 2.85 million a year earlier | CES |
| Hourly earnings, plumbing, heating and air-conditioning contractors, August 2026 | $42.01 | $39.85 a year earlier | CES |
Are construction job openings rising or falling?
Falling from their peak. Construction employers had an average of 400,000 job openings in 2022, an openings rate of 4.9%. In 2025 the average was 240,000, a rate of 2.8%, the same as in 2017 and lower than in any year from 2018 to 2024. By our calculation, that is 40% fewer openings than in 2022.
In August 2026 there were 251,000 construction openings, a seasonally adjusted rate of 2.9%. BLS said job openings changed little in every industry that month. Averaging the published not seasonally adjusted monthly rates for January to August, construction openings ran at about 3.1% in 2026 against 2.9% in the same months of 2025, our calculation.
Construction's openings rate has been below the all-industry rate in every year from 2015 to 2025; in 2025 the all-industry rate was 4.3%.
| Year | Average job openings | Openings rate | Hires rate | Quits rate | Openings rate, all industries |
|---|---|---|---|---|---|
| 2015 | 148,000 | 2.2% | 5.1% | 1.8% | 3.8% |
| 2016 | 197,000 | 2.8% | 5.0% | 1.8% | 3.9% |
| 2017 | 200,000 | 2.8% | 5.5% | 2.2% | 4.0% |
| 2018 | 274,000 | 3.6% | 5.2% | 2.4% | 4.6% |
| 2019 | 319,000 | 4.1% | 5.5% | 2.3% | 4.5% |
| 2020 | 257,000 | 3.4% | 5.7% | 1.8% | 4.3% |
| 2021 | 344,000 | 4.4% | 4.9% | 2.4% | 6.4% |
| 2022 | 400,000 | 4.9% | 4.7% | 2.4% | 6.8% |
| 2023 | 387,000 | 4.6% | 4.6% | 2.0% | 5.6% |
| 2024 | 301,000 | 3.5% | 4.2% | 1.8% | 4.6% |
| 2025 | 240,000 | 2.8% | 4.0% | 1.8% | 4.3% |
What do hires and quits show?
Construction hires averaged 4.0% of employment a month in 2025, down from 5.5% in 2019 and the lowest annual average in JOLTS data back to 2001. The quits rate, which BLS says can indicate how willing or able workers are to leave their jobs, was 1.8% in 2025, below 2.4% in 2021 and 2022.
Fewer openings, slower hiring and fewer quits suggest a cooler market for construction workers than in 2021 to 2023. These are industry-wide payroll measures, so they do not show how long a homeowner or landlord waits for a contractor.
Construction hiring is also seasonal. Averaging the unadjusted monthly hires rate from 2015 to 2025, it peaked at about 6.5% in May and was lowest in December, at about 2.8%, our calculation.
Are there fewer residential trade contractor jobs?
Construction as a whole had 8.36 million payroll jobs in September 2026, the highest in BLS data going back to 1939, and 1.3% more than a year earlier. Among specialty trade contractors, the growth is in nonresidential work.
BLS publishes separate employment series for residential and nonresidential specialty trade contractors, such as plumbing, electrical, roofing and finishing firms. Residential specialty trade contractors had 2.34 million jobs in September 2026, 1.2% fewer than a year earlier and 3.3% below September 2024, their highest level since 2006. Nonresidential trade contractors reached 2.94 million, up 3.0% and the highest since the series began in 2001.
Residential remodelers had about the same number of jobs as a year earlier in August 2026. This page does not identify why residential trade employment has declined.
| Industry | Latest month | Latest | Year earlier | Change |
|---|---|---|---|---|
| All construction | September 2026 | 8,364.0 | 8,255.0 | +1.3% |
| Residential building construction | September 2026 | 922.7 | 926.7 | -0.4% |
| Residential remodelers | August 2026 | 455.6 | 455.0 | +0.1% |
| Residential specialty trade contractors | September 2026 | 2,340.3 | 2,369.1 | -1.2% |
| Nonresidential specialty trade contractors | September 2026 | 2,939.6 | 2,854.9 | +3.0% |
| Plumbing, heating and air-conditioning contractors | August 2026 | 1,338.6 | 1,315.2 | +1.8% |
| Electrical contractors | August 2026 | 1,160.5 | 1,114.6 | +4.1% |
Are tradespeople's wages rising?
Yes, in plumbing, HVAC and electrical work. Production and nonsupervisory employees of plumbing, heating and air-conditioning contractors earned an average of $42.01 an hour in August 2026, up 5.4% from a year earlier. At electrical contractors the average was $42.69, up 6.4%. In residential building construction it was $35.79, up 1.9%.
For production and nonsupervisory employees in construction as a whole the average was $39.20 in September 2026, up 4.3%; the repair costs page compares that with materials prices. In May 2025, the median wage for plumbers, pipefitters and steamfitters was $30.67 an hour and for electricians $30.38, against $24.51 for all occupations.
| Occupation | Employment | Median hourly wage | Median annual wage |
|---|---|---|---|
| Plumbers, pipefitters, and steamfitters | 465,840 | $30.67 | $63,800 |
| Electricians | 757,220 | $30.38 | $63,190 |
| HVAC mechanics and installers (heating, air conditioning and refrigeration) | 409,670 | $29.33 | $61,010 |
| Carpenters | 670,090 | $29.12 | $60,580 |
| Roofers | 135,490 | $26.65 | $55,440 |
| Painters, construction and maintenance | 225,190 | $23.75 | $49,400 |
| Maintenance and repair workers, general | 1,529,700 | $23.84 | $49,590 |
| Construction laborers | 1,096,780 | $22.66 | $47,120 |
| All occupations | 155,495,730 | $24.51 | $50,980 |
What this means for landlords
These are considerations to weigh against what you see locally, not a forecast or advice for any particular job.
- National measures can hide local tightness. If good tradespeople are booked out where you own, local experience matters more than the national openings rate.
- Hourly earnings of production and nonsupervisory workers in plumbing, HVAC and electrical contracting rose by more than 5% over the past year, so labor-heavy repairs may cost more even where contractors are easier to book. A maintenance budget built on older quotes may need updating.
- Construction hiring peaks in late spring and is lowest in December. Scheduling non-urgent work such as painting or planned replacements outside the busiest months may give you more choice of contractors, though the data cannot show this for your area.
- Having more than one vetted contractor for urgent trades like plumbing and heating may shorten the wait when your first choice is booked.
- Contractors and handymen who work for themselves, rather than on a payroll, are generally not counted in these figures, so the data describe only part of the market you hire from.
Methodology
Job openings, hires and quits come from the BLS Job Openings and Labor Turnover Survey (JOLTS), a monthly survey of a sample of employers, for the construction industry. Annual figures are the annual averages BLS publishes in its not seasonally adjusted series; monthly figures for August 2026 are seasonally adjusted and preliminary. The openings rate is openings divided by employment plus openings; the hires and quits rates are divided by employment. The January to August averages and the seasonal pattern are our averages of the published not seasonally adjusted monthly rates.
Employment and hourly earnings come from the BLS Current Employment Statistics (CES) survey of payrolls, seasonally adjusted. Detailed industries are published a month after the construction total, so some rows end in August 2026. Earnings are average hourly earnings of production and nonsupervisory employees; BLS also publishes all-employee earnings, which run higher and rose somewhat less for plumbing and HVAC contractors (4.5% in the year to August 2026).
Occupation employment and median wages come from the May 2025 Occupational Employment and Wage Statistics (OEWS), national, all industries. We used BLS's public time-series files, downloaded on October 24, 2026; percentage changes are our calculations, rounded once at display.
Source: U.S. Bureau of Labor StatisticsSource: U.S. Bureau of Labor StatisticsSource: U.S. Bureau of Labor StatisticsSource: U.S. Bureau of Labor StatisticsSource: U.S. Bureau of Labor StatisticsSource: U.S. Bureau of Labor StatisticsSource: U.S. Bureau of Labor StatisticsSource: U.S. Bureau of Labor Statistics
Limitations
Keep these limits in mind.
- None of these measures is a direct count of a shortage. An opening is a position an employer is actively recruiting for, not a job that went unfilled, and the data do not show how long customers wait for work.
- JOLTS and CES count payroll employees. CES excludes sole proprietors and the unincorporated self-employed, JOLTS excludes proprietors and partners of unincorporated businesses, and OEWS leaves out the self-employed, so contractors and handymen who work for themselves rather than on a payroll are generally not in these figures.
- Monthly JOLTS figures for a single industry move around a lot, and BLS reported that job openings and hires changed little in all industries in August 2026. We did not run significance tests on the annual or year-to-date comparisons.
- The latest two months of CES data are preliminary, and each February BLS benchmarks employment to fuller counts, which can revise the series. JOLTS estimates are then recalculated.
- All figures used here are national.
- This page does not forecast labor availability or wages.
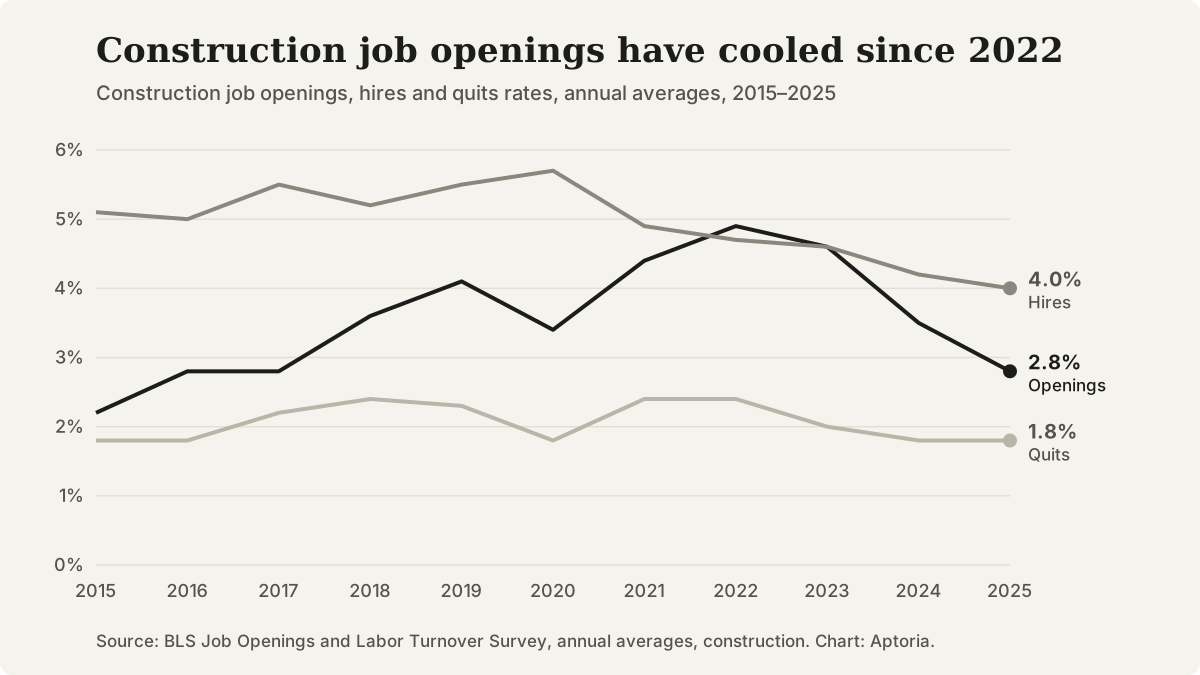
Construction job openings, hires and quits rates, annual averages, 2015 to 2025. Source: BLS Job Openings and Labor Turnover Survey.
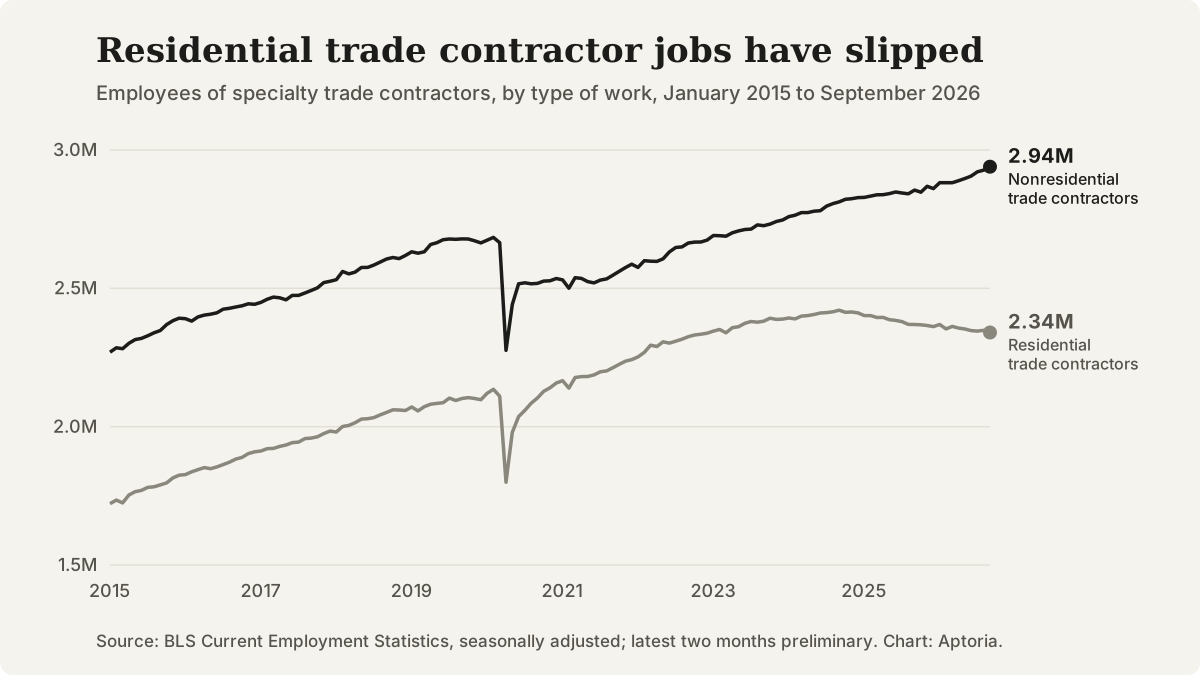
Employees of residential and nonresidential specialty trade contractors, seasonally adjusted, January 2015 to September 2026. Source: BLS Current Employment Statistics.
Questions that come up
Does this page count self-employed contractors and handymen?
No. CES excludes sole proprietors and the unincorporated self-employed, JOLTS excludes proprietors and partners of unincorporated businesses, and the OEWS occupation data leave out self-employed workers.
Why are total construction jobs at a record if residential trades are down?
The growth is in other parts of construction. Among specialty trade contractors, nonresidential firms added about 84,700 jobs over the year to September 2026, while residential firms lost about 28,800, our calculation from BLS data.
What is the difference between job openings and hires?
Openings are positions an employer is actively recruiting for on the last business day of the month that could start within 30 days. Hires are everyone added to the payroll during the month. In construction, average monthly hires were higher than average openings in every year from 2015 to 2025 except 2022 and 2023. In 2022, openings averaged 400,000 and monthly hires about 368,000, our calculation.
When is the next update?
BLS scheduled September 2026 job openings data for November 3, 2026, and publishes payroll employment monthly. The occupation wage figures are annual; the May 2025 data were the latest available on October 24, 2026.
Sources and references
Follow each source to check the underlying claim. Access checks and professional review are different steps.