The short answer
About 2.33 million households were using Housing Choice Vouchers in December 2025, according to HUD's Picture of Subsidized Households, out of 2.80 million vouchers HUD counted as available. On average HUD spent $1,255 a month per occupied voucher unit, a figure that includes an administrative amount for tenant-based vouchers, and households contributed $493 toward rent and utilities (excluding households that paid nothing).
Key takeaways
The national numbers
HUD's December 2025 snapshot counts 2,797,793 Housing Choice Vouchers available and 2,334,114 in use, so about 83% of available vouchers were being used to rent a home. HUD's file reports the count but does not say why the rest were not in use.
Most vouchers are tenant-based: the household chooses a home on the private market and can move with the assistance. 1,965,742 tenant-based vouchers were in use, compared with 358,741 project-based vouchers, which stay with a specific unit. The two rows add up to 9,631 fewer than the program total, and the file does not explain the gap.
Among tenant-based voucher households, 31% lived in units with zero or one bedroom, 35% in two-bedroom units and 34% in units with three or more.
| Measure | Value |
|---|---|
| Vouchers available (HUD's count of units under contract and available) | 2,797,793 |
| Vouchers in use (occupied units) | 2,334,114 |
| Share in use (our calculation) | 83.4% |
| Tenant-based vouchers in use | 1,965,742 |
| Project-based vouchers in use | 358,741 |
| Average HUD spending per occupied unit, per month (includes an administrative amount for tenant-based vouchers) | $1,255 |
| Average household contribution toward rent and utilities, per month | $493 |
| Average months between joining a waiting list and admission (programs that report dates) | 27 |
| Households in the program less than a year (HUD's "moved in past year") | 7% |
| Households receiving a utility allowance | 85% |
| Average utility allowance, among households that get one | $174 a month |
How does a voucher pay the rent?
About 2,000 local public housing agencies run the program with HUD funding, according to HUD. The agency approves the unit and the rent, then signs a housing assistance payments (HAP) contract with the owner and pays its share of the rent directly to the landlord. The household pays the rest.
HUD's regulation says that when the rent is below the agency's payment standard, the family generally pays 30 percent of adjusted monthly income. When the rent is above it, the family pays more. At the start of a new tenancy in a unit whose gross rent exceeds the payment standard, the family's share may not exceed 40 percent of adjusted monthly income.
Agencies set payment standards by unit size, and HUD's basic range is 90 to 110 percent of the Fair Market Rent. Our page on HUD Fair Market Rents covers how those rents are set. The agency must also find the rent reasonable compared with similar unassisted units.
Source: U.S. Department of Housing and Urban DevelopmentSource: Electronic Code of Federal Regulations (National Archives)Source: Electronic Code of Federal Regulations (National Archives)Source: Electronic Code of Federal Regulations (National Archives)Source: U.S. Department of Housing and Urban Development, Office of Policy Development and Research
How has the program changed since 2015?
The number of vouchers available rose every year in HUD's files, from 2.45 million in 2015 to 2.80 million in 2025, up 14.3%. The share in use, as HUD rounds it, was 89% in 2015 and 83% in 2025.
Average HUD spending per occupied unit rose from $775 a month in 2015 to $1,255 in 2025, up 61.9%, and has risen every year since 2017. The average household contribution rose more slowly, from $364 to $493, up 35.4%. These are our calculations from HUD's yearly figures, in dollars not adjusted for inflation.
The two averages are measured differently, so do not add them to get a rent. HUD's spending figure includes an administrative amount for tenant-based vouchers, and the household figure covers rent and utilities and leaves out households paying zero.
| Year | Vouchers available | Share in use (HUD) | HUD spending per month | Household contribution per month |
|---|---|---|---|---|
| 2015 | 2,447,016 | 89% | $775 | $364 |
| 2016 | 2,474,400 | 90% | $784 | $364 |
| 2017 | 2,489,182 | 89% | $753 | $370 |
| 2018 | 2,527,803 | 88% | $793 | $379 |
| 2019 | 2,556,270 | 88% | $807 | $390 |
| 2020 | 2,624,936 | 88% | $834 | $386 |
| 2021 | 2,669,691 | 85% | $883 | $395 |
| 2022 | 2,718,084 | 83% | $948 | $420 |
| 2023 | 2,752,351 | 84% | $1,068 | $450 |
| 2024 | 2,787,090 | 84% | $1,174 | $468 |
| 2025 | 2,797,793 | 83% | $1,255 | $493 |
Where are vouchers most common?
Across the 50 states and D.C., about 6.7 vouchers were in use for every 1,000 residents. The District of Columbia had the highest rate (19.6), followed by Massachusetts (13.0), New York (12.4), Vermont (11.3) and Connecticut (10.8).
The lowest rates were in Arizona (3.1), Utah (3.3), Idaho (3.3), Kansas (3.6) and Delaware (4.3); Wyoming was next, also 4.3 when rounded. D.C. is a single city, so its rate is not directly comparable with whole states.
By count, California, New York, Texas and Florida had the most vouchers in use, 36% of the 50-state and D.C. total.
| State | Vouchers in use | Per 1,000 residents | HUD spending per month | Household contribution per month | Months waiting |
|---|---|---|---|---|---|
| District of Columbia | 13,584 | 19.6 | $1,514 | $346 | 15 |
| Massachusetts | 92,714 | 13.0 | $1,735 | $607 | 31 |
| New York | 247,467 | 12.4 | $1,643 | $565 | 40 |
| Vermont | 7,308 | 11.3 | $1,069 | $488 | 17 |
| Connecticut | 39,936 | 10.8 | $1,435 | $596 | 41 |
| Delaware | 4,510 | 4.3 | $1,073 | $512 | 43 |
| Kansas | 10,705 | 3.6 | $715 | $407 | 19 |
| Idaho | 6,702 | 3.3 | $946 | $456 | 20 |
| Utah | 11,662 | 3.3 | $871 | $436 | 25 |
| Arizona | 23,508 | 3.1 | $1,381 | $435 | 25 |
How much does HUD spend per voucher in each state?
Average HUD spending per occupied unit was highest in California, Massachusetts and Hawaii ($1,780, $1,735, $1,685 a month) and lowest in Arkansas, West Virginia and Iowa ($586, $590, $595).
This page does not adjust these averages for local rents or household size, and HUD adds an administrative amount for tenant-based vouchers. For a specific area, the housing agency's payment standards and HUD's Fair Market Rents are a better guide to what a voucher can cover.
State averages here are limited to states where HUD received reports for at least 90% of occupied units. That leaves out New Hampshire, Oregon, South Carolina and Indiana (65%, 87%, 88%, 89% reported).
How long are voucher waiting lists?
Nationally, households with recorded waiting-list dates had waited an average of 27 months between joining a waiting list and admission (29 months for tenant-based vouchers). HUD's average leaves out programs that do not report waiting-list dates, and in the 2025 file the Moving to Work rows are coded as missing for this measure.
Among the 46 states (counting D.C.) with a figure and at least 90% reporting, the longest averages were in Maryland, Delaware, Connecticut and Rhode Island (62, 43, 41, 41 months), and the shortest were in Wyoming, West Virginia and North Dakota (10, 10, 11 months). Alaska had no reported figure.
After a household is selected and receives a voucher, HUD says the voucher's search time is 60 to 120 days, as set by the agency, and households can ask for an extension.
Source: U.S. Department of Housing and Urban Development, Office of Policy Development and ResearchSource: U.S. Department of Housing and Urban Development, Office of Policy Development and ResearchSource: U.S. Department of Housing and Urban Development, Office of Policy Development and ResearchSource: U.S. Department of Housing and Urban Development
What this means for landlords
These are considerations from HUD's rules and guidance, not legal advice. Your housing agency's procedures and your state and local laws also apply.
- Plan for an inspection before move-in. The unit generally must pass before the lease term starts. An agency with up to 1,250 budgeted tenant-based voucher units must inspect, and tell you and the family the result, within 15 days of the request for tenancy approval, not counting any time the unit is unavailable. Larger agencies must act within a reasonable time, within 15 days where practicable. Some agencies use alternative inspection options, so ask yours.
- Expect the first payment after the HAP contract is signed. The agency may not pay before then, the contract must be signed within 60 calendar days of the lease start (HUD may approve a later contract only for extenuating circumstances), and payments then cover the lease from its start, up to 60 days. After that, the agency must pay promptly when due under the contract.
- Budget for periodic inspections. HUD requires them at least every two years (every three for small rural agencies). For reported problems, owners must fix life-threatening deficiencies within 24 hours and others within 30 days or an approved extension. HUD says NSPIRE inspection standards are replacing Housing Quality Standards. Agencies must switch by February 1, 2027, and until then may keep using the older standards, so ask yours which applies.
- Keep the rent split clean. The agency must find your rent reasonable against similar unassisted units, and you may not demand or accept more from the tenant than the rent to owner minus the agency's payment.
- Screen consistently. HUD says landlords select tenants using their own criteria. Apply the same written criteria to every applicant, and check local rules, because laws on source of income vary by state and locality.
Source: Electronic Code of Federal Regulations (National Archives)Source: Electronic Code of Federal Regulations (National Archives)Source: Electronic Code of Federal Regulations (National Archives)Source: Federal Register (U.S. Department of Housing and Urban Development)Source: U.S. Department of Housing and Urban DevelopmentSource: U.S. Department of Housing and Urban Development
Methodology
We use HUD's Picture of Subsidized Households U.S. and state files for 2025 (based on 2020 Census geography) and the U.S. files for 2015 through 2024. Figures are for the Housing Choice Voucher program as a whole unless labeled tenant-based or project-based.
"Vouchers available" is HUD's count of units under contract for federal subsidy and available for occupancy, and "in use" is its count of occupied units. Household averages come from tenant reports HUD received as of December, with effective dates spanning the prior 18 months. HUD spending is housing assistance payments divided by occupied units, plus an administrative amount for tenant-based vouchers. The household contribution includes rent and utilities and excludes zero values.
Rates per 1,000 residents divide vouchers in use by the Census Bureau's Vintage 2025 population estimate for July 1, 2025. Puerto Rico and other territories are left out of state comparisons. HUD publishes dollar figures and months already rounded; we compute shares and changes from those published values and round once.
We plan to refresh this page when HUD publishes the 2026 edition of the dataset.
Source: U.S. Department of Housing and Urban Development, Office of Policy Development and ResearchSource: U.S. Department of Housing and Urban Development, Office of Policy Development and ResearchSource: U.S. Department of Housing and Urban Development, Office of Policy Development and ResearchSource: U.S. Department of Housing and Urban Development, Office of Policy Development and ResearchSource: U.S. Census Bureau
Limitations
Keep these limits in mind.
- The data are a once-a-year snapshot built from administrative reports (HUD Forms 50058 and 50059), and the files include no margins of error.
- Averages depend on which households were reported. HUD codes figures as missing, suppressed or non-reporting in some cells, and reporting rates vary by state.
- The waiting-list average covers only programs that report waiting-list dates, and it describes households that were admitted, not people still waiting.
- Dollar figures are not adjusted for inflation, and HUD's definitions can change between editions.
- State averages mix high- and low-cost areas. Payment standards are set locally, so a statewide average says little about a specific unit.
- This page does not forecast program funding or voucher counts.
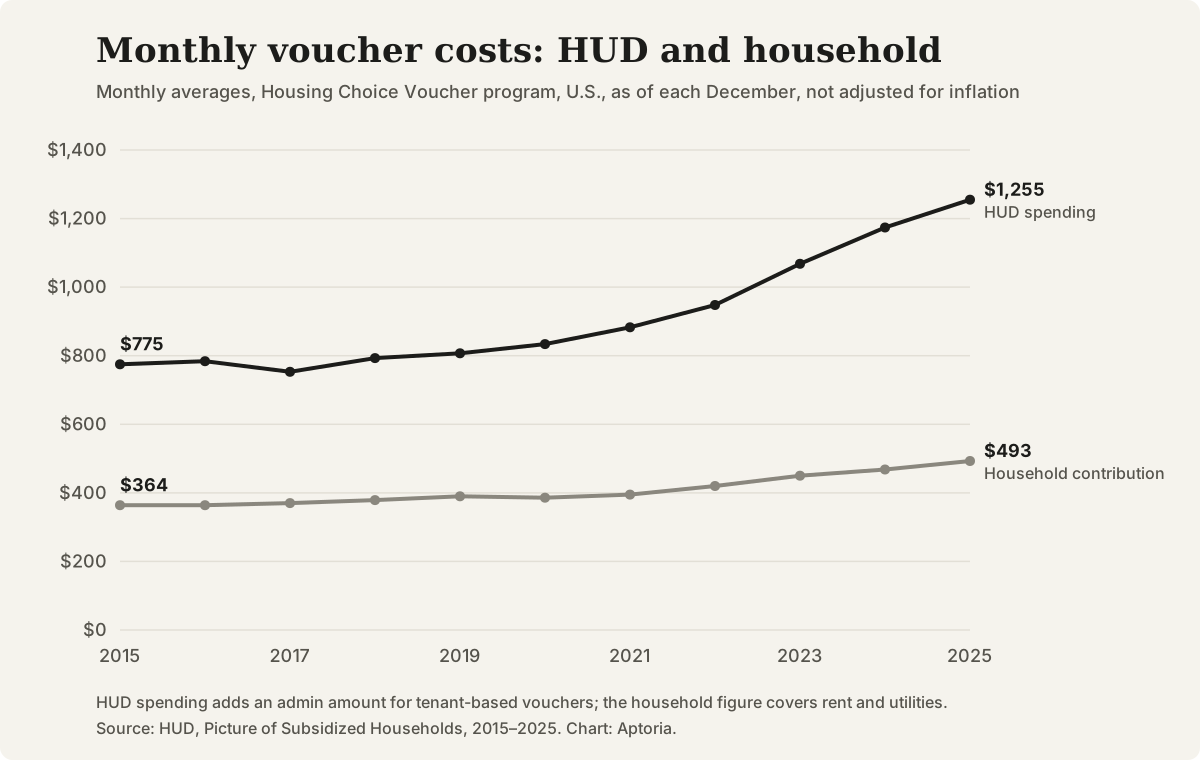
Average monthly HUD spending and household contribution per Housing Choice Voucher unit, U.S., 2015–2025, not adjusted for inflation. Source: HUD, Picture of Subsidized Households.
Questions that come up
Is Section 8 the same as a Housing Choice Voucher?
Yes. HUD describes the Housing Choice Voucher program as also known as Section 8. The figures here include project-based vouchers, which are part of the voucher program, but not HUD's separate Project Based Section 8 contracts with properties.
Who pays the landlord?
The local housing agency pays its share, the housing assistance payment, directly to the landlord under a HAP contract. The household pays the remainder of the rent to the landlord.
How often are voucher units inspected?
Generally before the lease starts, then at least every two years under HUD's rule (every three years for small rural agencies). Agencies also inspect when a tenant or official reports a problem. Some agencies use alternative inspection options.
Does this page say whether a landlord must accept vouchers?
No. Rules on source of income vary by state and locality. Check the law where your property is, or ask a local attorney.
Sources and references
Follow each source to check the underlying claim. Access checks and professional review are different steps.