The short answer
HUD's database counts 3.86 million apartments in 55,345 Low-Income Housing Tax Credit projects placed in service from 1987 through 2024, 3.61 million of them low-income units. From 2013 to 2022, about 97,700 units a year were placed in service, below the 2007 peak of 148,468. HUD says 2023 and 2024 are not yet complete.
Key takeaways
The national numbers
HUD's National LIHTC Database covers projects placed in service from 1987 through 2024 and lists 55,345 projects with 3,860,546 units. That total includes 67 projects reported for 2025 or later and 2,765 with an unknown or unconfirmed year placed in service. Of all units, 3,611,592, or 94% by our calculation, are low-income units.
Allocating agencies report 11,229 projects (471,789 units) as no longer monitored for LIHTC compliance; HUD's reason codes include a completed extended-use period and a sale under a qualified contract. HUD's data dictionary notes that this status does not indicate whether a project still serves low-income households.
| Measure | Value |
|---|---|
| Projects | 55,345 |
| Units | 3,860,546 |
| Low-income units | 3,611,592 |
| Low-income share of units (our calculation) | 93.6% |
| Projects still monitored for LIHTC compliance | 44,116 |
| Units in monitored projects | 3,388,757 |
| Projects no longer monitored | 11,229 |
| Projects with an unknown or unconfirmed placed-in-service year | 2,765 |
How does the tax credit work?
The Low-Income Housing Tax Credit is a federal income tax credit for owners of rental housing that sets aside units for lower-income households. State and local housing credit agencies allocate the credits, and HUD's database lists those allocating agencies.
Under 26 U.S.C. 42 (2024 edition; the 2025 amendments did not change these tests), an owner elects one of three minimum set-asides: at least 20 percent of units rent-restricted and occupied by households at or below 50 percent of area median gross income, at least 40 percent at or below 60 percent, or an average income test, under which at least 40 percent of units are rent-restricted and occupied by households within income limits the owner designates for each unit, in 10-point steps from 20 to 80 percent of area median income, with the designated limits averaging no more than 60 percent. The average income test was added in 2018.
A unit is rent-restricted when its gross rent does not exceed 30 percent of the imputed income limitation that applies to it. The statute sets a 15-year compliance period and an extended use period that ends no earlier than 15 years after it; HUD's data dictionary describes 30 years as the LIHTC minimum affordability period.
This page describes the program only as the statute and HUD describe it. It does not cover credit amounts or how the credit is taxed, and Congress can change the rules.
How many tax-credit apartments are built each year?
Units placed in service rose through the 1990s and early 2000s and peaked in 2007 at 148,468 units in 1,806 projects. From 2013 through 2022, the ten years before the two that HUD flags as incomplete, an average of about 97,700 units in about 1,165 projects were placed in service each year.
The database shows 81,407 units for 2023 and 64,269 for 2024. HUD says those years are not complete because owners can take 3 or more years to meet placed-in-service requirements after a property begins leasing, so the counts are likely to rise as later updates arrive.
Data for properties placed in service in 2025 are scheduled to be collected in fall 2026 and added to the database in spring 2027, according to HUD.
| Year | Projects | Units | Low-income units |
|---|---|---|---|
| 2015 | 1,215 | 93,927 | 86,906 |
| 2016 | 1,271 | 105,002 | 97,344 |
| 2017 | 1,095 | 96,493 | 90,305 |
| 2018 | 1,124 | 96,186 | 90,772 |
| 2019 | 1,112 | 102,164 | 95,364 |
| 2020 | 1,193 | 101,986 | 97,625 |
| 2021 | 1,079 | 96,825 | 92,639 |
| 2022 | 1,020 | 97,048 | 93,224 |
| 2023 | 929 | 81,407 | 79,391 |
| 2024 | 787 | 64,269 | 62,318 |
Are projects getting bigger?
Yes. By our tabulation, projects placed in service from 1987 to 1999 averaged about 47 units, and projects from 2020 to 2024 averaged about 88. HUD's published table shows similar averages.
New construction made up 69% of projects placed in service from 2020 to 2024 that reported a construction type, the highest share of the four periods, with acquisition and rehabilitation of existing buildings at 28%.
The share of projects with a nonprofit sponsor, among projects that reported it, rose in each period, from 15% in 1987 to 1999 to 33% in 2020 to 2024.
| Period | Projects | Average units per project | New construction | Acquisition and rehab | Nonprofit sponsor |
|---|---|---|---|---|---|
| 1987 to 1999 | 18,517 | 47 | 59% | 39% | 15% |
| 2000 to 2009 | 15,904 | 81 | 63% | 35% | 25% |
| 2010 to 2019 | 13,084 | 79 | 58% | 39% | 30% |
| 2020 to 2024 | 5,008 | 88 | 69% | 28% | 33% |
Which income limits do recent projects use?
Of the 4,698 projects placed in service from 2020 to 2024 that reported an elected ceiling, 76.3% chose the 60 percent of area median income ceiling, 18.3% chose income averaging and 5.4% chose the 50 percent ceiling (our tabulation). Another 310 projects did not report one.
Income averaging has grown each year since it was added: 4.8% of reporting projects placed in service in 2018 elected it, against 24.9% in 2024, though the 2023 and 2024 counts are not complete.
Where are tax-credit apartments?
Across the 50 states and D.C., about 11.2 LIHTC units have been placed in service since 1987 for every 1,000 residents today, by our calculation. The District of Columbia has the highest rate (46.9), followed by New York (17.2), Vermont (16.3), Washington (15.5) and Mississippi (15.3).
The lowest rates are in Pennsylvania (6.2), Idaho and Arizona (6.5 each), Kentucky (7.2) and Connecticut (7.5).
By count, California, New York, Texas and Florida have the most units, 34% of the 50-state and D.C. total. These are cumulative counts of units ever placed in service, including projects no longer monitored, so they are not a count of today's restricted stock.
| State | Units placed in service | Units in monitored projects | Per 1,000 residents |
|---|---|---|---|
| District of Columbia | 32,560 | 30,194 | 46.9 |
| New York | 344,743 | 330,600 | 17.2 |
| Vermont | 10,538 | 8,878 | 16.3 |
| Washington | 124,354 | 118,187 | 15.5 |
| Mississippi | 45,191 | 37,942 | 15.3 |
| Connecticut | 27,671 | 27,495 | 7.5 |
| Kentucky | 33,279 | 28,162 | 7.2 |
| Arizona | 49,702 | 39,989 | 6.5 |
| Idaho | 13,093 | 11,014 | 6.5 |
| Pennsylvania | 80,784 | 62,889 | 6.2 |
What does HUD's tenant data show?
HUD's tenant data for December 31, 2023 report a vacancy rate of 5.2% across 2,338,687 units. California and the U.S. Virgin Islands did not submit 2023 tenant data, Mississippi submitted data for only 67 units, and HUD says its data are included only in the submission and matching tables, and Nevada is left out of the vacancy count.
Among households with income reported, median annual household income was $18,600. Among households with both income and rent reported, 40.6% paid more than 30 percent of income in rent (our sum of HUD's bands) and 15.2% paid more than 50 percent. HUD notes that Michigan and Oklahoma reported incomes of $1 for most households in 2023, which, by our reading, pulls the median down and pushes the rent-burden shares up.
48.3% of households received some rental assistance (amount not reported for 14.6%). Of households with assistance, 20.3% were using a tenant-based Housing Choice Voucher (source not reported for 24.9%); our voucher page covers that program.
Coverage is partial: HUD matched 63.9% of the 43,201 active properties in its 2023 property database to tenant records, so treat these as broad totals.
| Measure | Value |
|---|---|
| Units reported for the vacancy count | 2,338,687 |
| Vacancy rate (HUD) | 5.2% |
| Active properties in HUD's 2023 property database matched to tenant records | 63.9% |
| Median annual household income, households with income reported | $18,600 |
| Households paying more than 30% of income in rent (our sum of HUD's bands) | 40.6% |
| Households paying more than 50% of income in rent | 15.2% |
| Households receiving any rental assistance | 48.3% |
| Of households with assistance, share using a tenant-based Housing Choice Voucher | 20.3% |
What this means for landlords
These are considerations, not tax or legal advice.
- Tax-credit rents have a ceiling tied to income limits. Under the statute, a restricted unit's gross rent, which includes a utility allowance but not voucher or other Section 8 payments, cannot exceed 30 percent of the income limit that applies to it. Where market rents are above that ceiling, a nearby LIHTC project can rent for less. Compare your units with both market and restricted rents nearby.
- New supply arrives steadily. About 97,700 LIHTC units a year were placed in service from 2013 to 2022, and most recent projects are new construction. HUD's database lists project addresses if you want to see what exists near your property.
- Vouchers and tax credits overlap. About 20% of assisted LIHTC households in HUD's 2023 tenant data used a tenant-based voucher. Rules on accepting vouchers and other sources of income vary by state and locality.
- Older projects can leave the program. HUD lists projects no longer monitored for compliance, but says that status does not show whether a project is still affordable.
- If you are considering the credit for your own property, talk with a tax professional and your state housing finance agency. This page does not cover eligibility or credit amounts.
Methodology
We tabulated every record in HUD's National LIHTC Database file for projects placed in service through 2024. Our totals match HUD's published table: 55,345 projects, 3,860,546 units, 44,116 monitored projects with 3,388,757 units, and the yearly project and unit counts for 2015 through 2024.
Units use HUD's recoded fields: total units, or total low-income units when the total is missing or inconsistent, and the matching low-income field. Average project size is total units divided by projects with a unit count; HUD's published averages differ from ours by no more than 0.1 unit.
Construction type, nonprofit sponsor and elected income ceiling shares use only projects that reported the item. Periods use the year placed in service; projects with an unknown year are in the totals but not in the periods or yearly counts.
Rates per 1,000 residents divide all units placed in service since 1987 by the Census Bureau's Vintage 2025 population for July 1, 2025. Territories are left out of state comparisons.
Tenant figures are HUD's published national totals from its 2023 tenant tables. We report totals only and do not use the tables' demographic breakdowns.
We plan to refresh this page when HUD adds 2025 placements in spring 2027 and when HUD publishes 2024 tenant data.
Source: U.S. Department of Housing and Urban Development, Office of Policy Development and ResearchSource: U.S. Department of Housing and Urban Development, Office of Policy Development and ResearchSource: U.S. Census BureauSource: U.S. Department of Housing and Urban Development, Office of Policy Development and Research
Limitations
Keep these limits in mind.
- The database is compiled from reports by state and local housing finance agencies, and recent years are incomplete: HUD says owners can take 3 or more years to meet placed-in-service requirements.
- HUD revises earlier years as agencies add or correct records, so counts for a given year can change between editions.
- Cumulative counts include projects no longer monitored for LIHTC compliance and do not show how many restricted units exist today.
- Some fields were first collected for later years (the income ceiling starts with 2006 properties) and others, such as nonprofit sponsor, are not reported for every project.
- The tenant data exclude California and the U.S. Virgin Islands for 2023, cover only 67 Mississippi units, and match only part of the database, so national tenant figures are not a full count.
- Program rules are from the 2024 edition of the U.S. Code. A 2025 law (Pub. L. 119-21) later raised state credit ceilings by 12% for 2026 onward and, for buildings placed in service in tax years beginning after 2025, lowered the share of a building's and its land's basis that must be financed with tax-exempt bonds to 25% in some cases; it did not change the set-aside, rent or compliance-period rules described here.
- This page does not forecast LIHTC production or funding.
Source: U.S. Department of Housing and Urban Development, Office of Policy Development and ResearchSource: U.S. Department of Housing and Urban Development, Office of Policy Development and ResearchSource: U.S. Department of Housing and Urban Development, Office of Policy Development and ResearchSource: U.S. Department of Housing and Urban Development, Office of Policy Development and ResearchSource: U.S. Government Publishing Office (GovInfo), Office of the Law Revision CounselSource: U.S. Government Publishing Office (GovInfo)
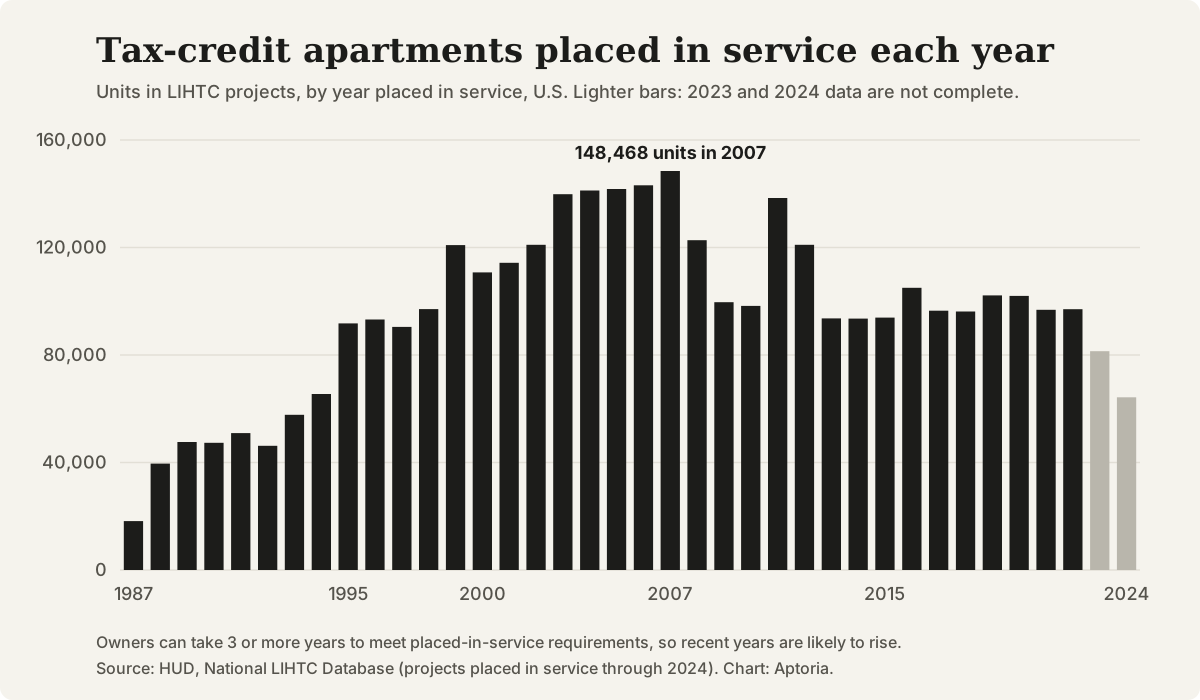
Units in LIHTC projects by year placed in service, U.S., 1987 to 2024. 2023 and 2024 are not complete. Source: HUD, National LIHTC Database.
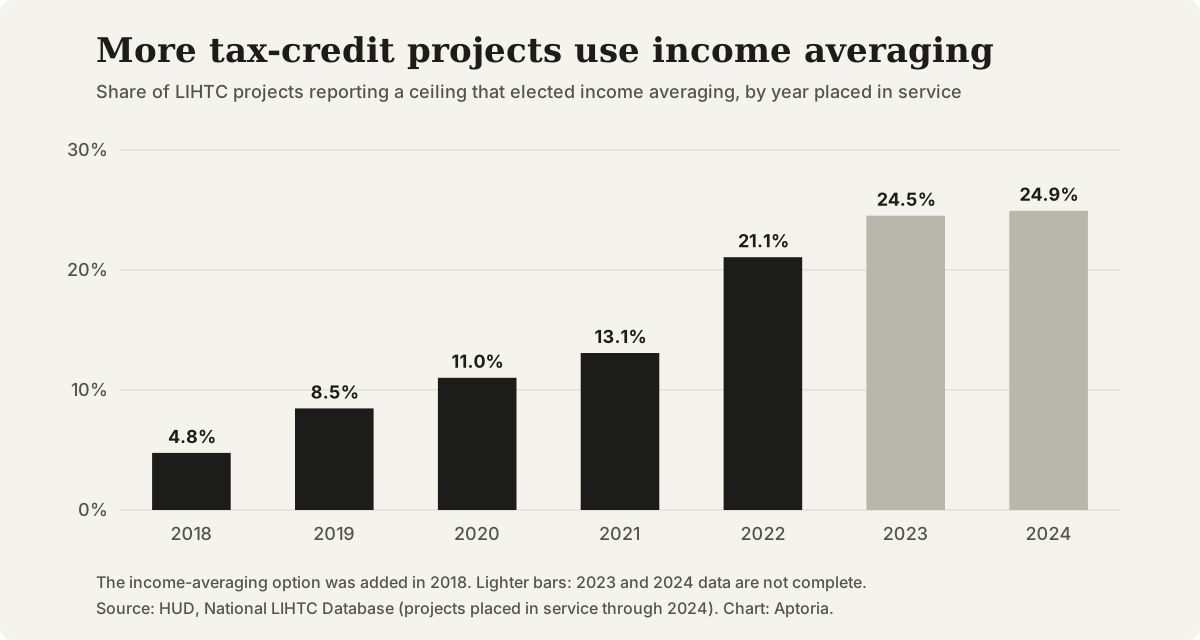
Share of LIHTC projects reporting a ceiling that elected income averaging, by year placed in service, 2018 to 2024. 2023 and 2024 are not complete. Source: HUD, National LIHTC Database.
Questions that come up
Is a LIHTC apartment the same as Section 8 housing?
No. The tax credit helps owners build or rehabilitate rental housing with income and rent limits. A Housing Choice Voucher, often called Section 8, is rental assistance paid on behalf of a household. A household in a LIHTC unit can also use a voucher: in HUD's 2023 tenant data, about one in five assisted LIHTC households used a tenant-based voucher.
How long do LIHTC apartments have to stay affordable?
The statute sets a 15-year compliance period and an extended use period that ends no earlier than 15 years after it. HUD's data dictionary describes 30 years as the minimum, and some projects commit to longer periods. The statute ends the extended use period early if the building is acquired by foreclosure (unless that was arranged to end it), or if, after the 14th year, the owner asks the state agency to find a buyer and the agency cannot present a qualified contract within a year, unless the agreement or state law rules that out. Existing low-income tenants then keep protection from eviction without good cause and from rent increases beyond the program's limits for 3 years.
Why do the latest years show fewer units?
HUD says 2023 and 2024 data are not complete because owners can take 3 or more years to meet placed-in-service requirements after a property starts leasing. Counts for recent years usually rise as later updates are added.
Does this page say whether a property qualifies for the credit?
No. This page reports HUD's data and the statute's basic rules. Eligibility and credit amounts depend on details it does not cover, so ask a tax professional and your state housing finance agency.
Sources and references
Follow each source to check the underlying claim. Access checks and professional review are different steps.