The short answer
Over 2015 to 2025, Louisiana, Maine and West Virginia averaged the most time without power per electricity customer: about 21.5, 17.9 and 14.2 hours a year, against a U.S. average of about 6.4 hours (our averages of EIA figures). In 2025 the average U.S. customer was without power about 4.5 hours, down from 11.0 in 2024.
Key takeaways
The key numbers
The U.S. Energy Information Administration (EIA) measures outages with two standard utility metrics. SAIDI is the minutes of non-momentary interruptions the average customer experienced in a year, and SAIFI is how many such interruptions the average customer experienced. This page converts SAIDI to hours.
The figures follow the IEEE 1366 standard. In 2025, EIA estimates they covered about 79% of U.S. customers. Each metric is reported both with and without major event days, the days a utility's outages exceed a threshold set from its own past five years of data.
| Measure | 2025 | 2024 | Average, 2015 to 2025 (ours) |
|---|---|---|---|
| Hours without power, all days | 4.5 | 11.0 | 6.4 |
| Hours without power, excluding major event days | 2.1 | 2.2 | 2.0 |
| Interruptions, all days | 1.34 | 1.53 | 1.38 |
| Interruptions, excluding major event days | 1.08 | 1.07 | 1.05 |
| Share of customers covered (EIA estimate) | 79% | 79% | Not published |
Which states have the most outage time?
Averaged over the 11 years EIA publishes by state, Louisiana customers were without power about 21.5 hours a year, Maine customers about 17.9 hours and West Virginia customers about 14.2 hours. South Carolina and Mississippi follow. The U.S. average over the same years was about 6.4 hours (our averages of EIA's annual figures).
An average can be pulled up by one or two very bad years. Louisiana's median year was about 7.4 hours, far below its average. Maine had the highest median year of the ranked states, about 15.1 hours, so its long outage years recur rather than coming from one or two storms. Most of Maine's outage time still falls on major event days (ours).
| State | Average hours a year, 2015 to 2025 | Median year, hours | 2025, hours | Customers covered, 2025 |
|---|---|---|---|---|
| Louisiana | 21.5 | 7.4 | 4.5 | 73% |
| Maine | 17.9 | 15.1 | 6.1 | 100% |
| West Virginia | 14.2 | 12.6 | 16.9 | 98% |
| South Carolina | 11.2 | 5.5 | 2.6 | 96% |
| Mississippi | 10.9 | 8.7 | 8.7 | 69% |
| North Carolina | 10.1 | 4.8 | 3.2 | 90% |
| Florida | 10.0 | 3.3 | 1.2 | 84% |
| Michigan | 9.9 | 8.7 | 10.1 | 94% |
| Texas | 9.0 | 4.7 | 3.5 | 66% |
| Connecticut | 8.5 | 3.2 | 3.1 | 100% |
| Arkansas | 8.1 | 7.3 | 7.9 | 82% |
| Georgia | 7.2 | 4.5 | 4.5 | 88% |
Which states have the least?
At the other end, customers in the District of Columbia averaged about 1.1 hours a year without power over 2015 to 2025, and Arizona customers about 1.6 hours. D.C. is a single city, so it may not be directly comparable with states that have large rural service areas (our observation).
| State | Average hours a year, 2015 to 2025 | 2025, hours | Customers covered, 2025 |
|---|---|---|---|
| District of Columbia | 1.1 | 0.8 | 99% |
| Arizona | 1.6 | 1.1 | 95% |
| Nevada | 2.0 | 2.1 | 103% |
| Delaware | 2.2 | 1.7 | 87% |
What happened in 2024 and 2025?
2024 had the most outage time in EIA's 2015 to 2025 table, at about 11.0 hours per customer. EIA attributes 80% of those hours to major events such as Hurricanes Beryl, Helene and Milton, and it reports that South Carolina customers had nearly 53 hours without power that year, the most of any state.
2025 was calmer nationally, at about 4.5 hours. Among the ranked states, West Virginia had the most outage time, about 16.9 hours per customer, followed by Michigan at about 10.1 hours. West Virginia also had the most outage time excluding major event days, about 8.3 hours.
| State | Minutes, all days | Hours, all days | Hours excluding major event days | Interruptions, all days |
|---|---|---|---|---|
| West Virginia | 1,013.2 | 16.9 | 8.3 | 3.08 |
| Michigan | 608.6 | 10.1 | 2.7 | 1.42 |
| Alaska | 563.5 | 9.4 | 4.0 | 3.02 |
| Nebraska | 542.8 | 9.0 | 1.4 | 1.32 |
| Mississippi | 524.4 | 8.7 | 5.3 | 2.50 |
| Arkansas | 474.5 | 7.9 | 3.5 | 2.17 |
| Missouri | 466.0 | 7.8 | 1.9 | 1.37 |
| Pennsylvania | 413.0 | 6.9 | 2.3 | 1.42 |
How often does the power go out?
The average U.S. customer had 1.34 interruptions in 2025. Among the ranked states, West Virginia and Alaska had the most, about 3.08 and 3.02 per customer, then Mississippi at 2.50.
Frequency and duration are different problems. EIA says outages tend to be more frequent in states such as Maine and Vermont, often because of storm damage to trees that affects power lines. EIA also says most of the difference in outage time between years comes from major events.
How much is routine and how much is storms?
Excluding major event days, the average U.S. customer has been without power for about two hours a year in every year from 2015 to 2025, between 1.9 and 2.2 hours. Including them, the total ranged from 3.5 to 11.0 hours. EIA says most of the difference between years comes from major events.
In 38 of the 45 ranked states, the median year had less than six hours without power (ours). Planning may still need to account for the rare long outage after a hurricane or other major event.
Which states have limited data?
The rankings on this page include only the 45 states (counting D.C.) where EIA's IEEE figures covered at least half of customers in 2025. Six states fell below that line. EIA's any-method table, which adds utilities that do not report under the IEEE standard, covers far more customers in those states, but it mixes methods, so this page does not rank states with it.
| State | Customers covered, IEEE method, 2025 | Customers covered, any method, 2025 |
|---|---|---|
| Hawaii | 7.0% | 99.7% |
| Vermont | 10.8% | 89.8% |
| Alabama | 15.7% | 72.7% |
| New York | 23.6% | 99.3% |
| Virginia | 30.6% | 97.0% |
| Oklahoma | 45.9% | 89.8% |
What this means for landlords
These are considerations, not legal requirements. Rules on habitability, utilities and what a landlord must do during an outage vary by state and locality.
- A written outage plan for tenants can cover who to call, how to report an outage to the utility and where to find updates.
- FEMA's Ready.gov says a refrigerator keeps food cold for about four hours and a full freezer about 48 hours, which may be worth sharing with tenants before storm season.
- Ready.gov says generators and fuel belong outdoors and at least 20 feet from windows, doors and attached garages, that camp stoves and charcoal grills also belong outdoors, and recommends carbon monoxide detectors with battery backup on every level of a home.
- In cold-climate states, Ready.gov advises learning how to keep pipes from freezing and gathering supplies for several days without power.
- State averages hide local differences. The EIA-861 detailed files list SAIDI and SAIFI for each reporting utility, which can be a closer guide to the utility that serves your property.
Methodology
State and national figures come from EIA's Electric Power Annual Tables 11.1 to 11.5, released October 21, 2026 with 2025 data from Form EIA-861. We use the IEEE-standard values, which match the state figures EIA cites in its December 2025 article. SAIDI minutes and SAIFI counts are shown as EIA publishes them, and hours are minutes divided by 60.
The 2015 to 2025 averages and medians are ours: the simple mean and median of EIA's 11 published annual values for each state, not weighted by customers. The split between major event days and other days in the chart is the difference between EIA's values with and without major event days.
We left out states where EIA estimates its IEEE figures covered fewer than half of customers in 2025. EIA's EIA-861 detailed files also contain a State Totals sheet whose 2025 figures differ from the Electric Power Annual tables in 26 states, most of all Virginia and Missouri. In each of those states the sheet counts fewer customers than the utility-level records in the same file, and EIA does not explain the difference. The Electric Power Annual figures closely match a customer-weighted average of those utility records in 50 of 51 states (our check). This page uses the Electric Power Annual tables throughout.
Source: U.S. Energy Information AdministrationSource: U.S. Energy Information AdministrationSource: U.S. Energy Information AdministrationSource: U.S. Energy Information AdministrationSource: U.S. Energy Information AdministrationSource: U.S. Energy Information AdministrationSource: U.S. Energy Information Administration
Limitations
Read the numbers with these limits in mind.
- The figures are averages per customer. They say nothing about how many people were affected at once or how long the longest outage lasted.
- Momentary interruptions are not counted; SAIDI and SAIFI cover non-momentary interruptions only.
- Coverage varies by state and year. EIA's tables give coverage only for 2025 and 2024, so earlier years in the 11-year averages may cover a different share of customers.
- Each utility calculates its own major-event threshold from its own history, so the split between major event days and other days is not identical across utilities.
- Statewide figures hide large local differences between utilities.
- This page does not forecast outages.
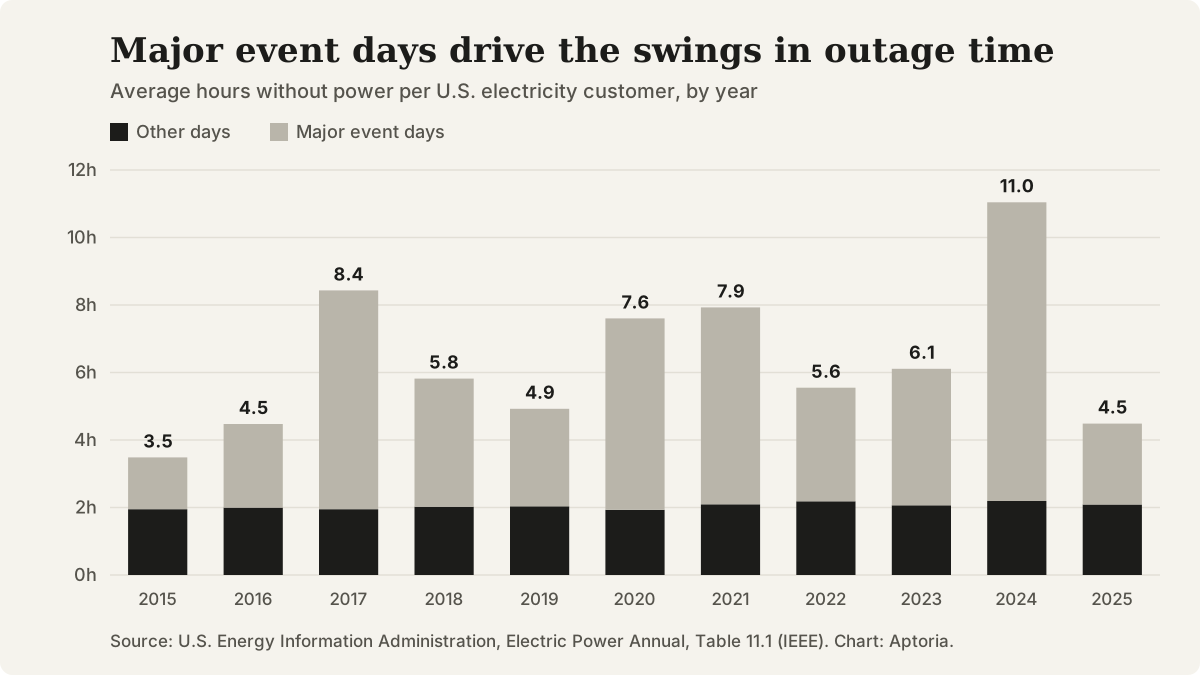
Average hours without power per U.S. electricity customer, 2015 to 2025, split into major event days and other days. Source: EIA, Electric Power Annual, Table 11.1 (IEEE).
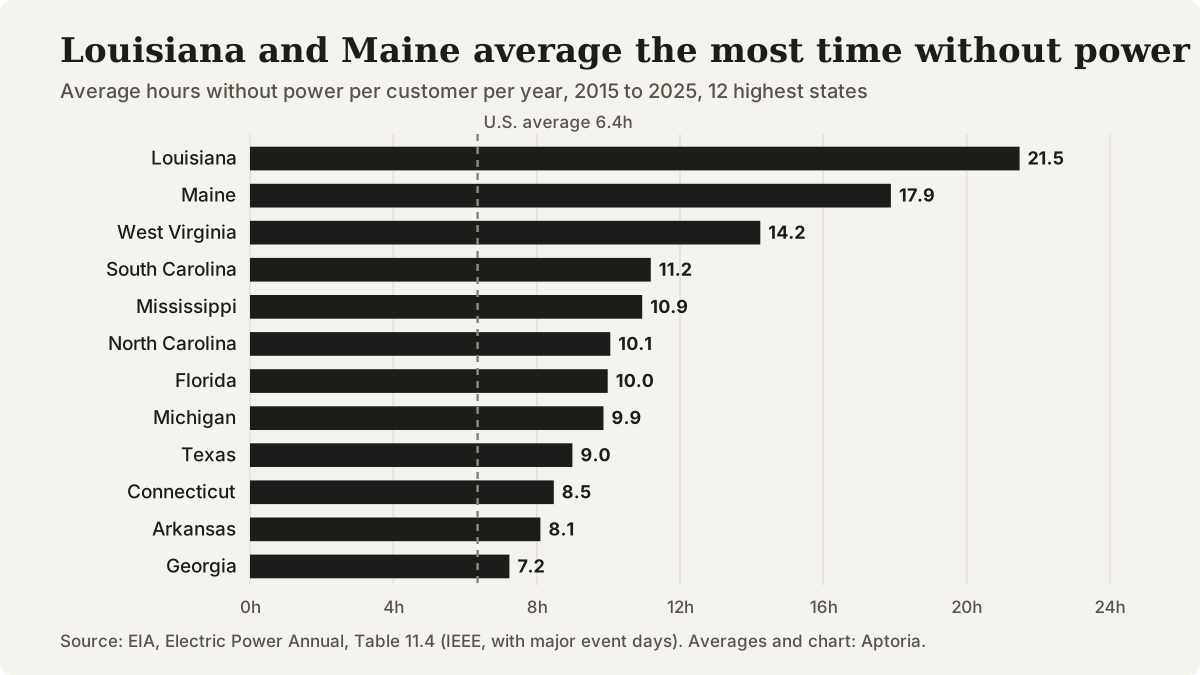
Average yearly hours without power per customer, 2015 to 2025, 12 highest states. Source: EIA, Electric Power Annual, Table 11.4 (IEEE); averages ours.
Questions that come up
Does this page show outages for my town or utility?
No. It reports statewide averages. EIA's EIA-861 detailed files list outage duration and frequency for each reporting utility, and many utilities also publish their own outage maps.
What counts as a major event day?
Under the IEEE standard, it is a day when a utility's daily outage minutes per customer (daily SAIDI) exceed a threshold calculated from its own daily figures for the past five years. Utilities that do not use the IEEE method decide for themselves what counts as a major event.
Why is my state missing from the rankings?
Six states were left out because EIA's IEEE figures covered fewer than half of their customers in 2025: Alabama, Hawaii, New York, Oklahoma, Vermont and Virginia. Their coverage under both methods appears in the limited-data table.
Does this page include brief flickers and momentary outages?
No. EIA's SAIDI and SAIFI count non-momentary interruptions only, so very short interruptions are not included.
Sources and references
Follow each source to check the underlying claim. Access checks and professional review are different steps.