The short answer
The U.S. Fire Administration estimates 344,600 residential building fires in 2023, killing 2,890 people and causing about $11.3 billion in losses. Cooking starts the most, 167,800 of them. In 2017 to 2019, one- and two-family homes had 63% of residential fires but about 80% of deaths (our calculation), while cooking caused 74% of multifamily fires.
Key takeaways
The key numbers
USFA's national estimates count 344,600 residential building fires in 2023, with 2,890 deaths, 10,400 injuries and about $11.3 billion in dollar loss. USFA's residential buildings include one- and two-family homes, multifamily buildings and other residential properties such as boarding houses, hotels and dormitories.
Over 2014 to 2023, USFA reports a 6% decrease in fires, a 5% increase in deaths, an 8% decrease in injuries and a 25% increase in dollar loss after adjusting for inflation. 2023 had the fewest fires and the most deaths of the 10 years.
USFA's statistics home page also gives a 2024 estimate of 343,000 residential building fires, with cooking the leading cause at 46.7%. Its detailed residential summaries, used on this page, still run through 2023.
| Measure | 2023 estimate | USFA trend, 2014 to 2023 |
|---|---|---|
| Fires | 344,600 | -6% |
| Deaths | 2,890 | +5% |
| Injuries | 10,400 | -8% |
| Dollar loss | $11.3 billion | +25% (adjusted for inflation) |
Are home fires becoming more or less common?
Fires moved between about 345,000 and 381,000 a year from 2014 to 2023, rising and falling from year to year before the 2023 low. Deaths ranged from 2,565 to 2,890.
USFA's stated trends differ from a simple comparison of the first and last years. USFA's summary page does not say how it calculates them; by our check, its figures match the change along a straight-line (least-squares) trend fitted to all 10 years. By our comparison of the 2014 and 2023 estimates, fires were 9.2% lower, deaths 4.5% higher and injuries 13.9% lower.
| Year | Fires | Deaths | Injuries |
|---|---|---|---|
| 2014 | 379,500 | 2,765 | 12,075 |
| 2015 | 380,900 | 2,565 | 11,475 |
| 2016 | 364,300 | 2,775 | 11,025 |
| 2017 | 371,500 | 2,695 | 10,825 |
| 2018 | 379,600 | 2,790 | 11,525 |
| 2019 | 354,400 | 2,830 | 12,625 |
| 2020 | 372,000 | 2,615 | 11,825 |
| 2021 | 353,500 | 2,840 | 11,400 |
| 2022 | 374,300 | 2,720 | 10,250 |
| 2023 | 344,600 | 2,890 | 10,400 |
What causes most home fires?
Cooking is the leading cause by a wide margin: 167,800 residential building fires in 2023, or about 49% of all residential building fires by our calculation. USFA reports cooking as the leading cause over the 2014 to 2023 period.
The next causes in 2023 were other unintentional or careless actions (31,500), heating (27,900) and electrical malfunctions (23,700). Over 2014 to 2023, USFA reports heating fires down 31% and other careless fires up 42%.
| Cause | Fires, 2023 | Share of residential building fires (ours) | USFA trend, 2014 to 2023 |
|---|---|---|---|
| Cooking | 167,800 | 48.7% | -11% |
| Other unintentional, careless | 31,500 | 9.1% | +42% |
| Heating | 27,900 | 8.1% | -31% |
| Electrical malfunction | 23,700 | 6.9% | +2% |
How do fires in houses and apartment buildings differ?
USFA's most recent reports by building type cover 2017 to 2019. One- and two-family buildings, which USFA defines as detached homes, manufactured homes, mobile homes not in transit, and duplexes, had about 230,500 fires a year, 63% of residential building fires, and 2,220 deaths a year. Multifamily buildings such as apartments, town houses and condominiums had about 106,700 fires and 400 deaths a year.
Fires in one- and two-family homes were deadlier: 7.9 deaths per 1,000 reported fires against 3.1 in multifamily buildings, by USFA's NFIRS loss measures, and about 80% of residential fire deaths in those years by our calculation from USFA's averages. USFA's later report on fatal residential fires found 79% of them in one- and two-family dwellings in 2018 to 2020.
Cooking caused 74% of multifamily fires but 37% of one- and two-family fires, while heating caused 12% of one- and two-family fires and 4% of multifamily fires. USFA suggests small cooking fires in apartment buildings may be reported more often because neighbors or building alarms alert the fire department.
| Measure | One- and two-family | Multifamily |
|---|---|---|
| Fires per year | 230,500 | 106,700 |
| Share of residential building fires | 63% | 29% |
| Deaths per year | 2,220 | 400 |
| Injuries per year | 7,250 | 3,875 |
| Property loss per year | $6 billion | $1.7 billion |
| Deaths per 1,000 reported fires (NFIRS) | 7.9 | 3.1 |
| Dollar loss per reported fire (NFIRS, 2019 dollars) | $22,030 | $13,730 |
| Cooking share of fires | 37% | 74% |
| Heating share of fires | 12% | 4% |
| Electrical malfunction share of fires | 9% | 3% |
Where in the home do fires start?
Among nonconfined fires, which spread beyond a pot, fireplace or similar container, kitchens and cooking areas were the leading place of origin: 18% in one- and two-family buildings and 33% in multifamily buildings. Bedrooms were next in both, at about 12% to 13%.
USFA notes that only 40% of nonconfined multifamily fires that started in the kitchen were cooking fires. Fires were more common in cooler months in both building types, peaking in January, and residential building fires overall peaked from 5 to 8 p.m.
How often were smoke alarms present and working?
In nonconfined fires in occupied one- and two-family buildings, smoke alarms were reported present in 44% and absent in 23%; firefighters could not tell in 33%. In nonconfined multifamily fires, alarms were present in 64% and absent in 18%.
Alarms were reported to have operated in 26% of the one- and two-family fires and 42% of the multifamily fires. These are shares of incidents reported to NFIRS, not national estimates, and the two reports use different sets of fires, so the columns are not exact comparisons.
| Smoke alarm status | One- and two-family (occupied buildings) | Multifamily (all buildings) |
|---|---|---|
| Present | 44% | 64% |
| Present and operated | 26% | 42% |
| Present, failed to operate | 5% | 6% |
| Present, fire too small to activate | 6% | 8% |
| Present, operation undetermined | 7% | 9% |
| None present | 23% | 18% |
| Undetermined | 33% | 18% |
What this means for landlords
These figures describe fires nationally, not the risk at any one property. Some considerations follow from them.
- Cooking is the most common cause in every building type, so the kitchen may deserve the most attention in move-in walkthroughs and tenant materials.
- Heating causes a larger share of fires in houses and duplexes than in apartment buildings, and USFA links the winter rise in fires partly to heating. USFA recommends having heating equipment and chimneys cleaned and inspected by a professional each year.
- USFA recommends smoke alarms inside and outside each bedroom and sleeping area and on every level, interconnected so one sounding sets off all of them, tested monthly and replaced 10 years from the manufacture date, or as the manufacturer's instructions say.
- Smoke and carbon monoxide alarm requirements vary by state and locality. USFA notes that a city, county or state may require a specific type of alarm, so check local rules.
- Insurance and older-building condition are covered separately on the insurance cost and rental housing condition pages linked below.
Methodology
The yearly figures are USFA's national estimates from its residential fire estimate summaries for 2014 to 2023, retrieved 2026-10-25. USFA builds these by scaling data from its National Fire Incident Reporting System (NFIRS) to totals from NFPA's annual Survey of Fire Departments, and it adjusts earlier years' dollar loss for inflation, as described in its national estimates methodology dated 2012.
The comparisons by building type, cause, area of origin and smoke alarms come from USFA's Topical Fire Report Series reports on residential, one- and two-family and multifamily building fires, which cover NFIRS data for 2017 to 2019 and follow USFA's Volume 21 data sources and methodology document. Cause and origin shares have unknowns apportioned by USFA.
Our calculations are each cause's share of 2023 residential building fires, the 2014-to-2023 endpoint changes, and the share of residential fire deaths in one- and two-family buildings (USFA's one- and two-family average divided by its all-residential average for the same years). They are rounded once.
Limitations
- Fire department participation in NFIRS is voluntary. USFA says NFIRS captured 68% of NFPA's estimated fires in 2017 to 2019 and is not a complete census, which is why it publishes scaled national estimates.
- USFA has posted a 2024 headline estimate of residential building fires, but not yet 2024 deaths, injuries, losses or cause counts in its detailed summaries, so this page reports 2023 as the latest full year.
- The building-type, cause and smoke alarm figures are from 2017 to 2019, the latest years USFA has published in those reports. Patterns may have changed since.
- USFA notes that small, confined fires in one- and two-family homes are not reported to fire departments as often, which it suggests may help explain why cooking makes up a larger share of reported fires in apartment buildings than in houses.
- Smoke alarm shares are raw NFIRS counts, not national estimates. The one- and two-family figures cover occupied buildings only and the multifamily figures cover all buildings, and in many large fires firefighters could not determine whether an alarm was present.
- USFA's one- and two-family category includes manufactured homes and duplexes. The data do not separate owner-occupied homes from rentals, and this page is national; USFA's state profiles give state NFIRS snapshots.
- USFA's summary page does not explain how its 10-year trends are calculated; they differ from simple first-to-last-year changes and, by our check, match a least-squares trend line.
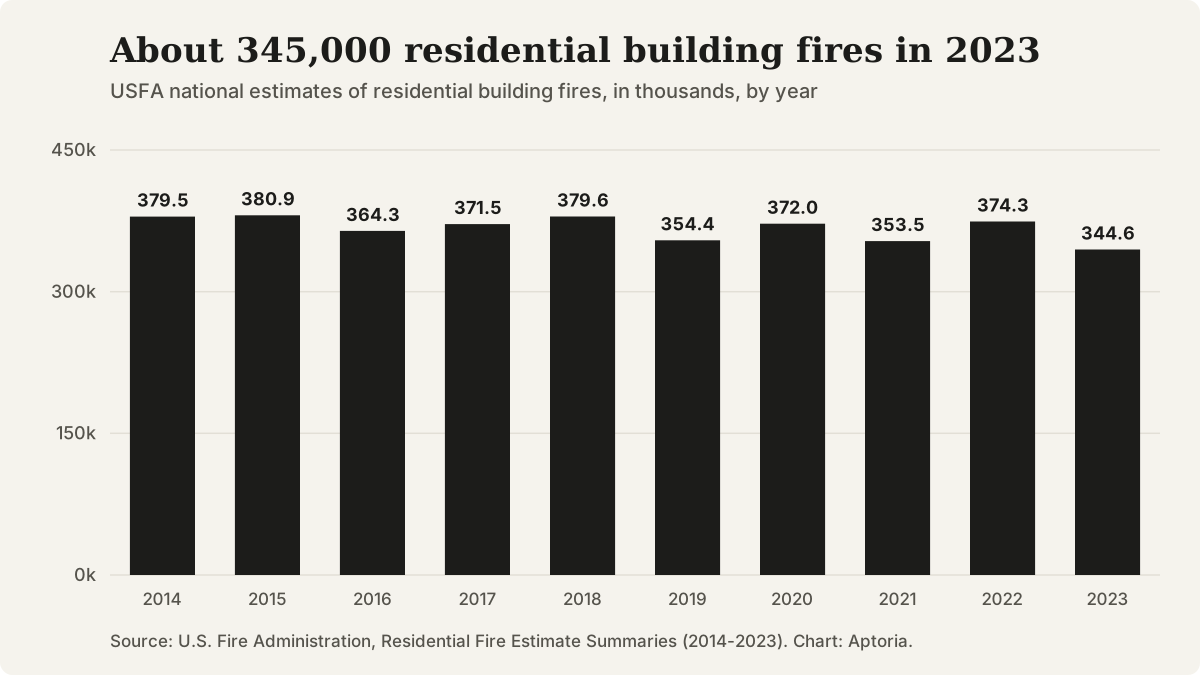
Residential building fires, USFA national estimates, 2014 to 2023, in thousands. Source: U.S. Fire Administration.
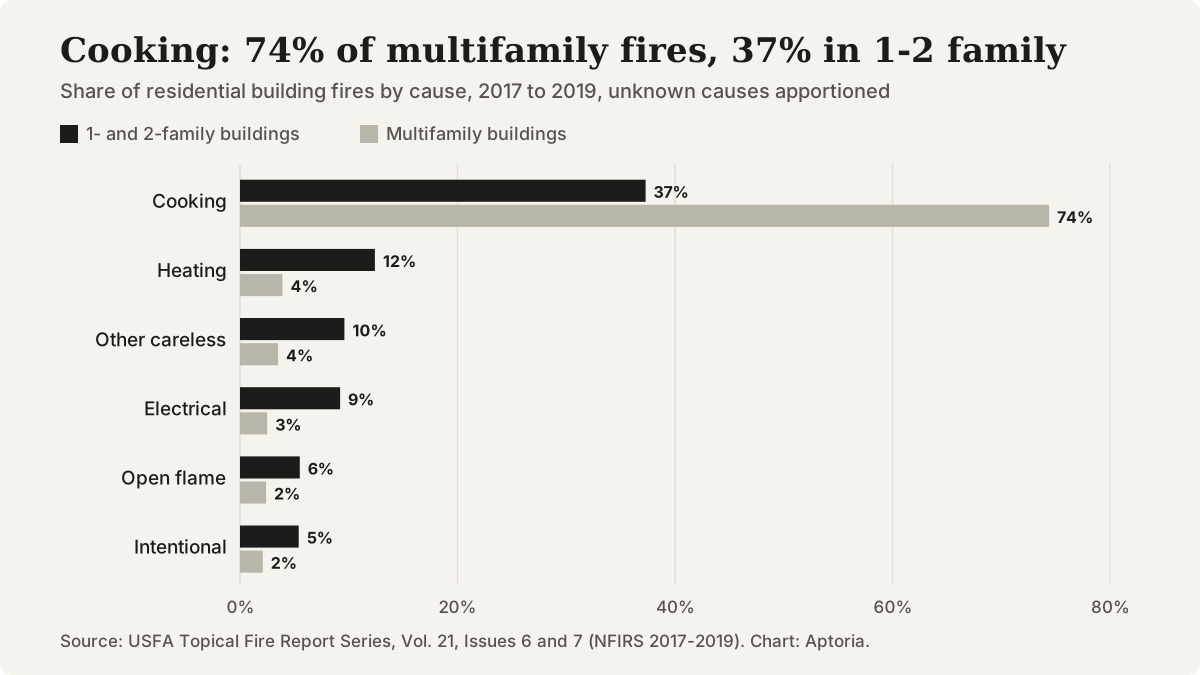
Leading causes of residential building fires by building type, 2017 to 2019, unknown causes apportioned. Source: USFA Topical Fire Report Series, Volume 21, Issues 6 and 7.
Questions that come up
Does this page show fire risk for my city or building?
No. These are national estimates and national NFIRS shares. USFA's state profiles summarize fires reported to NFIRS by state, and local fire departments or state fire marshals may have more detail.
Does this page separate rental homes from owner-occupied homes?
No. USFA reports fires by building type, such as one- and two-family or multifamily buildings, not by whether the home is rented.
What is a confined fire?
USFA calls a fire confined when it stays within a pot, fireplace or similar noncombustible container. These fires rarely cause serious injury or large losses; nonconfined fires spread beyond them.
Does this page cover carbon monoxide incidents?
No. The figures here are fires. Carbon monoxide alarm requirements, like smoke alarm requirements, vary by state and locality.
Sources and references
Follow each source to check the underlying claim. Access checks and professional review are different steps.