The short answer
New-home prices are lower than a year ago, but only the average drop is statistically clear. Census estimates the median new single-family home sold for $393,700 in August 2026, 5.8% below a year earlier, within the margin of error; the average fell a significant 8.8%. Builders had 483,000 homes for sale.
Key takeaways
The latest new-home numbers
These are Census and HUD estimates for August 2026, released September 24, 2026. They are preliminary and will be revised. The September report is scheduled for October 27, 2026.
Census says a change is statistically significant only when its 90% confidence interval excludes zero. Most of the year-over-year changes below do not meet that test.
| Measure | August 2026 | August 2025 | Change, with Census 90% interval |
|---|---|---|---|
| Sales, seasonally adjusted annual rate | 684,000 | 698,000 | −2.0% (±15.7 points), not significant |
| Homes for sale at month end | 483,000 | 493,000 | −2.0% (±4.0 points), not significant |
| Months' supply at the current sales rate | 8.5 | 8.5 | 0.0% (±15.8 points), not significant |
| Median sales price | $393,700 | $417,900 | −5.8% (±8.2 points), not significant |
| Average sales price | $478,700 | $525,100 | −8.8% (±7.7 points), significant |
| Completed homes for sale | 113,000 | 123,000 | No interval published |
Are new-home prices falling?
The median price is below its 2022 levels, but the latest year-over-year drop is not statistically clear. The median was $393,700 in August 2026, 14.5% below the record of $460,300 in October 2022. The year-over-year decline of 5.8% has a 90% interval of ±8.2 points, so Census cannot rule out no change.
The average price fell 8.8% from a year earlier, a change Census reports as significant. Census notes that changes in its price data reflect shifts in the mix of homes sold, by region, size and other features, as well as changes in prices for comparable homes, and that its sales prices include the land.
Annual medians show the longer trend: $434,500 in 2022, $417,400 in 2025, against $321,500 in 2019. In 2025, 18% of new homes sold were under $300,000, compared with 16% in 2024; Census publishes a standard error of about 2 points for that share, so the change may not be meaningful.
| Year | Median price |
|---|---|
| 2019 | $321,500 |
| 2022 | $434,500 |
| 2023 | $428,600 |
| 2024 | $420,300 |
| 2025 | $417,400 |
Are new homes cheaper than existing homes?
In August 2026, yes, on these measures. Census's median for new single-family homes was $393,700, while NAR's revised median for existing single-family homes was $433,600 ($427,700 for all existing housing types). That puts the new-home median about 9.2% lower.
Treat the gap as a rough guide. NAR counts existing homes when sales close, and notes that Census's new-home series counts a sale when a contract is signed or a deposit taken, so the two can move differently in the same month. NAR also cautions that its median prices are best compared with the same period a year earlier because of seasonality. A median also reflects which homes happened to sell, not a like-for-like price.
How many new homes are for sale, and how many are finished?
Builders had 483,000 new homes for sale at the end of August 2026, 2.0% fewer than a year earlier, a change within Census's margin of error. Of those, 113,000 were completed, 256,000 were under construction and 114,000 had not been started.
Completed homes for sale peaked at 128,000 in January 2026, the most since June 2009 (131,000), and have eased since. Today's level is well above the 2019 average of about 78,000, but completed homes are 23.4% of all homes for sale, close to the 2019 average share of 23.5%. Total inventory is higher than it was then.
Unsold finished homes had been on the market a median of 3.2 months since completion in August 2026, against 2.4 a year earlier (not seasonally adjusted; homes sold before completion are excluded). Census reports an average relative standard error of about 6% for the level of completed homes for sale and about 7% for the median months figure, and publishes no intervals for changes in these series.
| Stage | August 2026 | August 2025 |
|---|---|---|
| Not started | 114,000 | 96,000 |
| Under construction | 256,000 | 274,000 |
| Completed | 113,000 | 123,000 |
| Total for sale | 483,000 | 493,000 |
Is there an oversupply of new homes?
Supply is high by historical standards. At 8.5 months at the current sales pace, months' supply is above its 1963–2019 average of 6.1 and the 2019 average of 5.8. Those averages are our means of Census's seasonally adjusted monthly values, ending in 2019 as the last full year before the pandemic. Sales themselves are running near their 2019 pace: 684,000 a year in August 2026, against a 2019 average of about 685,000.
So far in 2026, unadjusted sales are 2.9% below the same months of 2025 (±5.1 points, not significant). The West shows the largest estimated drop, 10.0%, but that is also within its ±12.6-point interval.
What this means for landlords
These are considerations to weigh against your own market, not recommendations.
- Selling a rental: with 8.5 months of new-home supply, a resale house may be competing with new construction for the same buyers where builders are active.
- Buying: some builders have finished homes to sell. Compare total cost, not only price, and get local listing and closing data rather than relying on national figures.
- Renting: some new single-family homes are built specifically to rent. The build-to-rent page covers that separate count.
- National numbers hide large local differences. Use local comparables when pricing a sale, a purchase or a lease.
What changed in this update
First published October 24, 2026, with August 2026 data. We plan to refresh after the October 27, 2026 release.
Methodology
We pull Census's latest New Residential Sales release (PDF and tables) and its historical time series with a script and compute every figure from those files. Text from the release PDF is extracted with the poppler pdftotext tool. Significance statements are Census's own, from the 90% intervals it publishes.
Long-run averages (months' supply 1963–2019, 2019 averages) and the completed-home share are our calculations from Census's monthly series. The new-versus-existing comparison pairs the same month: Census's August 2026 new single-family median and NAR's revised August 2026 existing single-family median from its September breakouts table.
Limitations
Read the numbers with these limits in mind.
- Monthly new-home estimates are preliminary, come from a sample survey and are revised; many monthly and yearly changes are not statistically significant.
- Census does not publish intervals for changes in homes for sale by stage or for our derived averages and shares.
- Median and average prices reflect the mix of homes sold each month, not a constant-quality price index.
- The figures cover new single-family homes nationally; they do not show builder incentives, local prices or rental outcomes.
- This page does not forecast prices or sales.
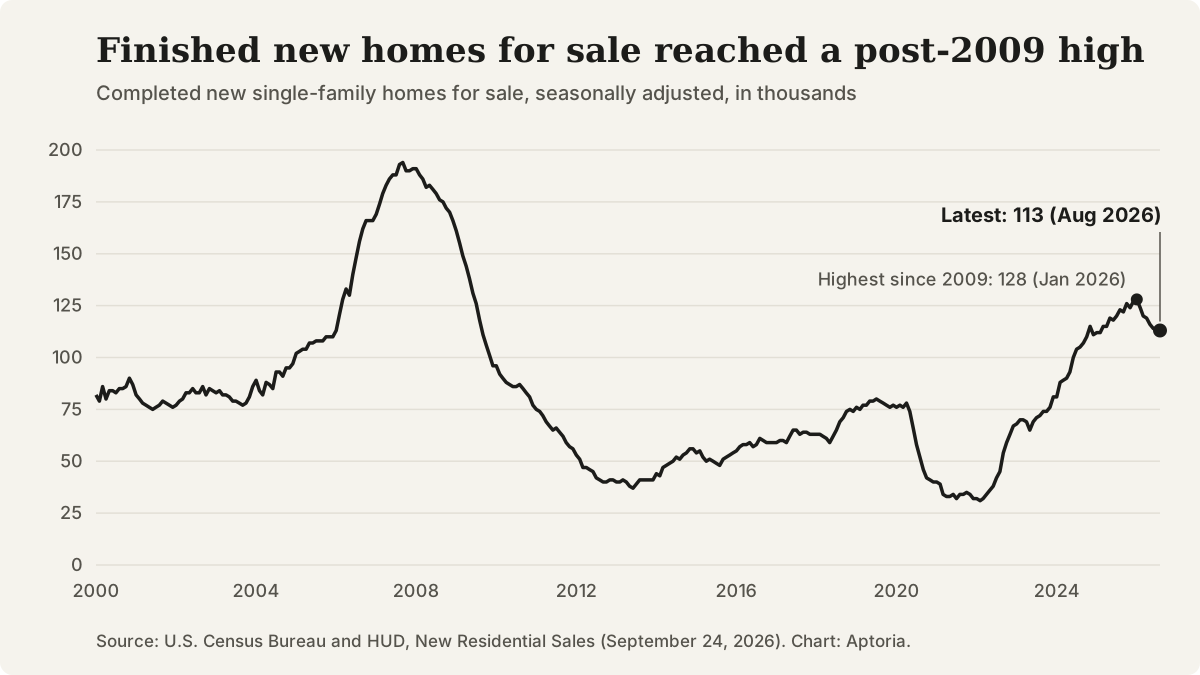
Completed new single-family homes for sale, seasonally adjusted, January 2000 to August 2026. Source: U.S. Census Bureau and HUD, New Residential Sales.
Questions that come up
What does months' supply mean?
Census defines it as homes for sale divided by homes sold: roughly how long the current inventory would last at today's sales pace if builders added no new homes. It was 8.5 months in August 2026.
Why do Census and NAR numbers sometimes move in opposite directions?
NAR counts existing homes when sales close, while Census counts new single-family homes when a contract is signed or a deposit accepted. NAR also covers condos and other housing types.
When is the next new-home sales report?
Census scheduled the September report for October 27, 2026.
Does this page forecast home prices?
No. It reports Census and NAR estimates with their margins of error and explains how to read them.
Sources and references
Follow each source to check the underlying claim. Access checks and professional review are different steps.