The short answer
About $127,200 on average in 2025. The Census Bureau and HUD's Manufactured Housing Survey puts the average new single-section home at $85,600 and double-section at $157,100, nearly double 2014 prices. 102,738 new homes were shipped in 2025 and about 70,700 were placed for residential use, about a quarter of them in land-leased communities.
Key takeaways
The key numbers
Prices, sizes and placements are Census estimates from the Manufactured Housing Survey, which HUD sponsors, for new homes built to the federal HUD code. Shipment counts are compiled by the Institute for Building Technology and Safety (IBTS) and published by Census; they count every home shipped rather than a sample. Prices are in current dollars, not adjusted for inflation. The last column is the relative standard error Census prints with each estimate, the standard error as a percent of the estimate.
| Measure | 2014 | 2025 | Census relative standard error, 2025 |
|---|---|---|---|
| Average sales price, all homes | $65,300 | $127,200 | 0.7% |
| Average sales price, single-section | $45,000 | $85,600 | 0.7% |
| Average sales price, double-section | $82,000 | $157,100 | 0.5% |
| Average square feet, all homes | 1,438 | 1,471 | 0.6% |
| Median square feet, all homes | 1,308 | 1,343 | 1.2% |
| Homes shipped | 64,331 | 102,738 | Not a sample estimate |
| Homes placed for residential use | Defined differently before 2021 | 70,700 | 1.3% |
How much does a new manufactured home cost?
The average new manufactured home sold for $127,200 in 2025: $85,600 for a single-section home and $157,100 for a double-section home. The all-homes average also includes the small number of homes with more than two sections. Census's relative standard error is under 1% for each national figure, so these are precise estimates.
The current survey form asks dealers for the home's sale price, or its list price if it is not yet sold, including dealer set-up costs and excluding taxes, land and on-site improvements. Census's glossary adds that there may be other costs to prepare a home for occupancy that the price leaves out. The survey's methodology says the average includes both actual prices for homes already sold and intended prices for homes still for sale. Prices of homes leased, or sold after they were placed, are not collected.
Prices rose about 95% from $65,300 in 2014, by our calculation, with the sharpest jump between 2020 and 2022 (about 46%). They changed little after 2022: the 2025 average was 3.2% above 2024, a statistically significant rise by our test using Census's relative standard errors, but essentially level with 2022's $127,300.
The latest monthly figure, for homes shipped in May 2026, was $130,500, with a relative standard error of 2.7%. Monthly estimates are less precise than annual ones; by our test the May 2026 figure is not significantly different from $126,800 a year earlier.
How big are they, and how does the cost compare with a site-built home?
The average new manufactured home had 1,471 square feet in 2025 and the median 1,343. Single-section homes averaged 1,073 square feet and double-section homes 1,766. About 83% of homes placed had three or more bedrooms, and about 40% were single-section, by our calculation from Census's counts.
Census publishes its own comparison with new single-family site-built homes, most recently for 2024. It put the average manufactured home at $84.45 per square foot and the site-built structure at $168.86, after subtracting a derived average land price of $108,561 from the $514,500 average price of new single-family site-built homes sold with their land as a package. By that measure a site-built home cost about twice as much per square foot. The site-built homes were also larger, at 2,404 square feet on average.
For 2025, our own division of Census's average price by average square feet gives about $86.47 per square foot for a new manufactured home. Census had not published a 2025 site-built comparison in the file used here. The two measures are not identical: the manufactured home price includes dealer set-up costs but may leave out other site preparation, so the comparison is a rough guide.
How many are shipped and placed each year?
Manufacturers shipped 102,738 new homes in 2025, against 103,314 in 2024 and 64,331 in 2014. In the shipments-to-states file, which starts in 1994, shipments peaked at 373,143 in 1998 and fell to a low of 49,717 in 2009. The 1998 figure is the peak since 1994, not the record: Census's 1959 to 2020 shipments file puts the highest year at about 579,900 in 1973. The 2025 total was below 2022's 112,882, the highest since 2006.
In the first eight months of 2026, monthly shipments added up to about 67,700, about 4% fewer than in the same months of 2025, by our sum of Census's monthly figures. The August figure is preliminary, and Census revises the prior two months with each release.
Census counts fewer homes placed than shipped: about 70,700 were placed for residential use in 2025. Dealers are surveyed about four months after shipment, and a home not yet placed at its final site by then, placed for non-residential use, or in Census's other category, which it describes as including lost, destroyed and FEMA homes, is not counted as a residential placement. Since 2021, placements have included homes placed on a site but not yet sold or leased; before that they counted only homes sold and placed, so placement counts before and after 2021 are not directly comparable.
Where are new manufactured homes placed?
Most go outside communities. Of the homes placed in 2025, about 62% were outside communities, nearly all on other private property, and about 38% were inside communities, by our calculation from Census's counts. About 18,700 homes, or 26%, went into land-leased or manufactured home communities, and about 7,800 onto private lots in subdivisions or planned developments.
The inside-communities share was 45.5% in 2024 and 37.6% in 2025, the lowest of the five years Census has published under its current categories, which ranged up to 58.9% in 2022. By our test, which is conservative because it treats the two counts as independent, the drop from 2024 is statistically significant. Homes on private lots in subdivisions or planned developments fell from about 15,500 to 7,800 (relative standard error 6.5% in 2025), while placements in land-leased communities rose from about 15,300 to 18,700. Census does not report why, and this page does not attribute a cause.
Most homes are titled as personal property: about 72% in 2025, against 22% titled as real estate, by our calculation. A small number were leased or held for lease by the time of the survey, about 3,100 homes combined, but those two estimates have relative standard errors of about 13% to 14%, so they are imprecise.
| Category | 2024 homes | 2025 homes | Share of 2025 placements (ours) | Census relative standard error, 2025 |
|---|---|---|---|---|
| All homes placed | 67,700 | 70,700 | 100% | 1.3% |
| Inside communities | 30,800 | 26,600 | 37.6% | 2.6% |
| Land-leased or manufactured home community | 15,300 | 18,700 | 26.4% | 3.2% |
| Private lot in a subdivision or planned unit development | 15,500 | 7,800 | 11.0% | 6.5% |
| Outside communities | 36,900 | 44,100 | 62.4% | 1.6% |
| Titled as personal property | 52,800 | 50,900 | 72.0% | 1.9% |
| Titled as real estate | 12,500 | 15,600 | 22.1% | 4.2% |
| Not titled | 2,400 | 4,200 | 5.9% | 8.1% |
| Sold | 55,800 | 56,500 | 79.9% | 1% |
| Intended for sale | 8,900 | 11,100 | 15.7% | 4.4% |
| Leased | 1,700 | 1,800 | 2.5% | 13.7% |
| Intended for lease | 1,300 | 1,300 | 1.8% | 13.3% |
Which states get the most new manufactured homes?
Texas received 17,458 new homes in 2025, about 17% of all shipments, by our calculation. Florida, North Carolina, Alabama and South Carolina followed, and the top 10 states together took about 60%. The South accounted for about 64% of homes placed.
Prices differ by region. The West had the highest average at $145,100 and the Midwest the lowest at $113,600; the South and Northeast averages were close and not significantly different by our test. State averages are less precise than national ones, and Census suppresses some to avoid disclosing individual dealers.
| State | Homes shipped, 2025 | Share of total shipments (ours) | Average sales price, 2025 | Census relative standard error of price |
|---|---|---|---|---|
| Texas | 17,458 | 17.0% | $124,500 | 1.8% |
| Florida | 6,804 | 6.6% | $133,500 | 2.9% |
| North Carolina | 6,269 | 6.1% | $127,300 | 3.3% |
| Alabama | 5,314 | 5.2% | $115,900 | 3.5% |
| South Carolina | 5,232 | 5.1% | $141,000 | 3.3% |
| Georgia | 4,807 | 4.7% | $131,300 | 3.6% |
| Louisiana | 4,607 | 4.5% | $109,100 | 3.7% |
| Mississippi | 3,994 | 3.9% | $130,300 | 4.1% |
| Tennessee | 3,829 | 3.7% | $138,200 | 3.8% |
| Kentucky | 3,800 | 3.7% | $125,200 | 4.1% |
Prices and placements by region
Regional averages for 2025, with the number of homes placed in each region. Census's regions follow its standard definitions.
| Region | Average price, all homes | Single-section | Double-section | Relative standard error, all homes | Homes placed |
|---|---|---|---|---|---|
| West | $145,100 | $89,000 | $167,600 | 1.4% | 9,400 |
| South | $126,900 | $84,900 | $155,500 | 1% | 45,500 |
| Northeast | $125,400 | $89,400 | $157,800 | 1.7% | 4,400 |
| Midwest | $113,600 | $85,400 | $154,200 | 1.1% | 11,300 |
What this means for landlords
These are considerations to weigh against your own market and properties, not recommendations.
- The average price is a starting point, not a total cost. Census says it includes dealer set-up but may leave out other costs to prepare a home for occupancy, so itemized quotes for site preparation and utility connections give a fuller picture.
- Prices vary by region and state. The West averaged $145,100 and the Midwest $113,600 in 2025; local dealer quotes will reflect your market better than national averages.
- Most new homes are titled as personal property. Census reports how homes are titled, not what titling means for financing, taxes or insurance, which depends on state rules; a local professional can tell you what applies.
- If you own homes in or near a land-leased community, about 18,700 new homes went into such communities nationally in 2025. Census does not publish this by state, so state shipment counts are one public guide to new supply in your state.
- Older and used homes are not in these figures. If you are buying an existing home, recent local sales of comparable homes are a better guide than new-home prices.
Methodology
Prices, square feet and placement characteristics come from the Manufactured Housing Survey, which the Census Bureau conducts and HUD sponsors. Each month Census samples about 405 homes from the IBTS list of HUD-inspected sections shipped and contacts the dealer about four months after shipment. The annual 2025 tables were posted in June 2026; the monthly shipment and price tables used here were posted October 6, 2026, with shipments through August 2026 and prices through May 2026.
Shipment counts are compiled from manufacturers' reports to IBTS and published by Census. They are a full count, not a sample, so they carry no sampling error. The state file allocates homes to the state they were shipped to; a small number marked destination pending are not assigned to a state, and totals may include shipments to Canada or Puerto Rico.
Census figures are shown as published. Our own figures are shares of placements and shipments, percent changes, the 2025 cost per square foot, and z-tests of differences using Census's relative standard errors at 90% confidence. The tests treat estimates as independent, which Census does not publish enough information to avoid; for shares of the same total this makes the tests conservative.
Limitations
Read the numbers with these limits in mind.
- Prices are averages in current dollars and are not adjusted for inflation. They describe new homes only, not used ones.
- The average includes intended prices for homes not yet sold, and it may leave out some site preparation costs.
- Placement categories and the definition of a placement changed in January 2021, so location and placement counts before 2021 are not directly comparable with later years.
- Census's characteristics tables report how homes are titled and where they are placed, not whether they are later rented out by their buyers.
- Relative standard errors measure sampling error only, not reporting or other nonsampling errors. Some state and category estimates are imprecise or suppressed.
- This page does not forecast prices or shipments.
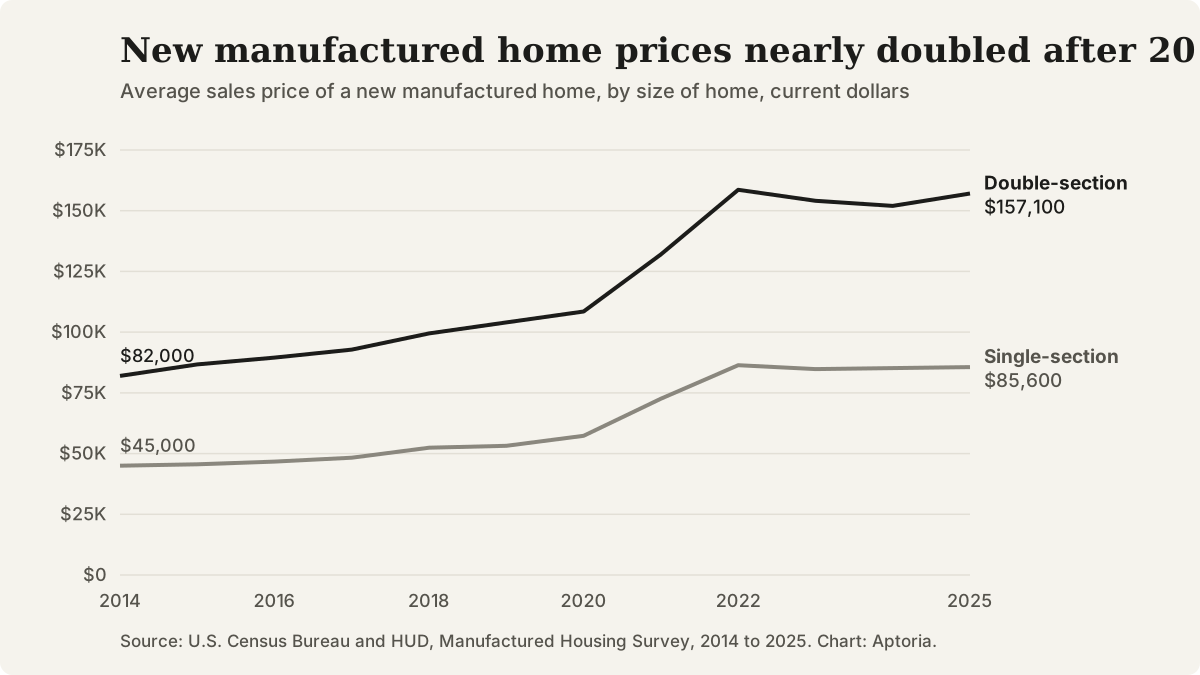
Average sales price of new manufactured homes by size of home, 2014 to 2025, current dollars. Source: U.S. Census Bureau and HUD, Manufactured Housing Survey.
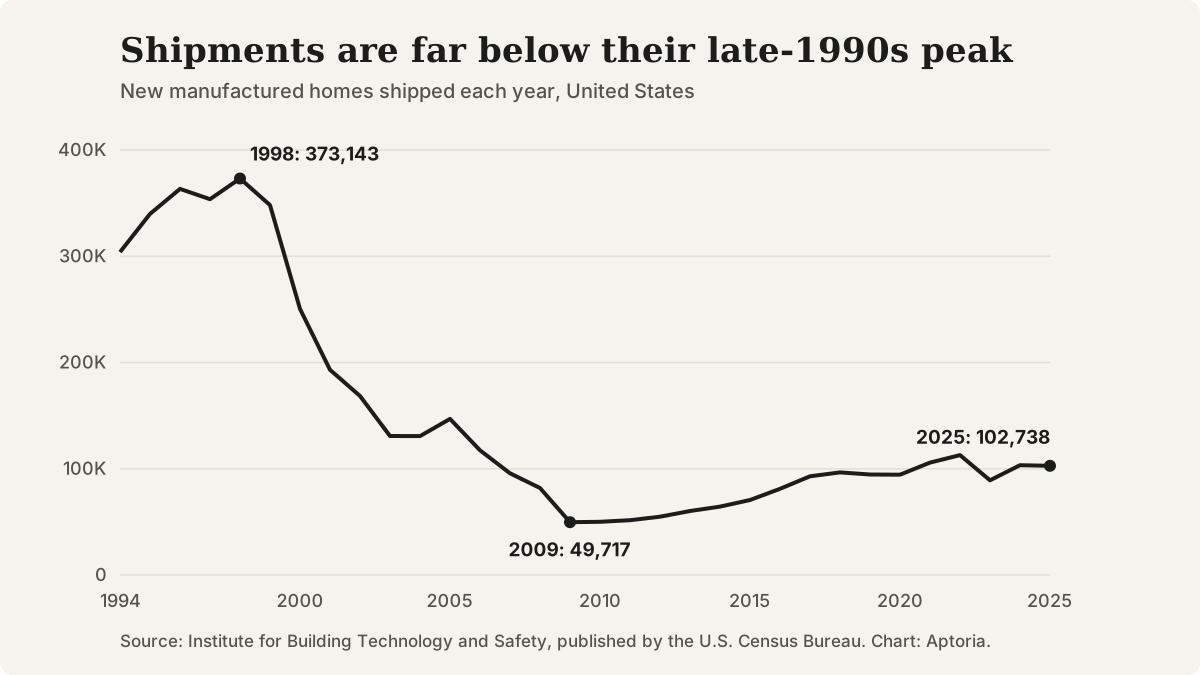
New manufactured homes shipped each year, 1994 to 2025. Source: Institute for Building Technology and Safety, published by the U.S. Census Bureau.
Questions that come up
Does this page include the cost of land?
No. The current survey form asks dealers for the sale price, or the list price if the home is not yet sold, including dealer set-up costs and excluding taxes, land costs and on-site improvements. When Census compares manufactured and site-built homes, it also subtracts an estimated land price from the site-built figure.
Does this page cover used manufactured homes?
No. The survey covers new homes built to the federal HUD code and shipped by manufacturers. Prices of homes that are leased, or sold only after they have been placed, are not collected.
Does this page say whether a manufactured home is a good rental investment?
No. It reports Census figures on prices, sizes, shipments and placements. Whether a home makes sense as a rental depends on local rents, site costs, local rules and financing terms, which this page does not cover.
When are these figures updated?
Census posts monthly shipment and price figures and releases the detailed annual tables each June. This page will be updated when the next annual tables are posted.
Sources and references
Follow each source to check the underlying claim. Access checks and professional review are different steps.