The short answer
Over the two years from 2019 to 2021, HUD's American Housing Survey analysis counts about 0.55 million rental homes lost from the housing stock and about 1.9 million added, while 4.2 million rentals became owner-occupied and 3.5 million owner homes became rentals. The rental stock, including vacant units for rent, grew by 878,000 units, or 1.8%.
Key takeaways
The key numbers
HUD's Components of Inventory Change (CINCH) report follows the same American Housing Survey addresses from one survey to the next. Of the 44.7 million renter-occupied homes in 2019, 80.2% were still renter-occupied in 2021, 18.9% were still housing but had become owner-occupied, vacant or seasonal, and 0.9% had left the housing stock (our shares of HUD's counts).
HUD's own loss rate for renter-occupied homes was 0.9%, against 0.4% for owner-occupied homes. The 2019 to 2021 report is the most recent edition on HUD's CINCH page.
| Measure | Units | Share of 2019 renter-occupied homes |
|---|---|---|
| Renter-occupied homes in 2019 | 44,660,000 | 100% |
| Still renter-occupied in 2021 | 35,825,000 | 80.2% |
| Still in the housing stock but not renter-occupied in 2021 (owner-occupied, vacant or seasonal) | 8,449,000 | 18.9% |
| Temporarily lost from the housing stock by 2021 | 344,000 | 0.8% |
| Permanently lost from the housing stock by 2021 | 42,000 | 0.1% |
| Renter-occupied homes in 2021 | 46,004,000 | not applicable |
Where rental homes went, and where new ones came from
HUD's companion Rental Dynamics report counts the rental stock more broadly, adding vacant units for rent, and puts it at 49.12 million homes in 2019 and 50.00 million in 2021. Over those two years, 6,647,000 of the 2019 rentals were no longer rentals and 7,249,000 of the 2021 rentals had not been rentals in 2019.
The largest flows were between renting and owning. 4.2 million rentals became owner-occupied homes and 3.5 million owner homes became rentals, a net shift of 709,000 toward owners. Both flows were larger than the 1.9 million homes added to the rental stock from outside the housing stock.
Excluding units HUD added to its sample in 2021 (explained under Limitations), about 13.9 million rental homes moved into or out of the rental stock in two years, by our sum of HUD's counts. The stock itself changed by 878,000 units.
| Flow | Out of rentals (2019 rentals that were not rentals in 2021) | Into rentals (2021 rentals that were not rentals in 2019) |
|---|---|---|
| Owner-occupied homes | 4,215,000 | 3,506,000 |
| Seasonal, second homes and related use | 1,879,000 | 1,846,000 |
| Lost from the housing stock | 554,000 | not applicable |
| Added by new construction | not applicable | 260,000 |
| Other additions (not the HUD-assisted oversample) | not applicable | 1,255,000 |
| Added by other means | not applicable | 382,000 |
| Total | 6,647,000 | 7,249,000 |
How many rental homes were lost?
HUD counts 554,000 rentals from 2019 as lost from the housing stock by 2021, about 277,000 a year if the two years are split evenly (our rough division). In the narrower renter-occupied count, 344,000 were temporary losses and 42,000 permanent ones.
HUD treats a unit as a temporary loss if it might return to the housing stock later, such as a home used for a business, one whose occupancy is prohibited, or one with its interior exposed to the elements. A permanent loss cannot return in its current form, such as a unit merged with another or eliminated in a conversion. Since 2019, HUD has classed demolished and disaster-loss units as temporary so the survey can keep following them.
Lower-cost rentals left the stock at higher rates. Renter-occupied homes costing under $500 a month were lost at 1.3% and those costing $500 to $799 at 1.2%, against 0.5% and 0.6% for homes costing $1,000 or more. HUD's tests found these different from all occupied homes, though HUD calls its tests indicative rather than conclusive. HUD notes the pattern tracks household income but does not identify a cause.
| Monthly housing cost in 2019 | Loss rate | Different from all occupied homes, by HUD's z-test? |
|---|---|---|
| No cash rent or HUD-assisted | 1.3% | Yes |
| Under $500 | 1.3% | Yes |
| $500 to $799 | 1.2% | Yes |
| $800 to $999 | 0.8% | No |
| $1,000 to $1,499 | 0.5% | Yes |
| $1,500 or more | 0.6% | Yes |
| All renter-occupied homes | 0.9% | Yes |
| All owner-occupied homes | 0.4% | Yes |
How many rental homes were added?
HUD's Rental Dynamics tables count 260,000 rentals added by new construction, 1,255,000 added in other ways and 382,000 added by other means, 1.9 million in all, or roughly 950,000 a year by our rough division. HUD's CINCH report describes other additions as units newly added to the survey sample that were built in 2019 or earlier, including older mobile homes that moved and new units from splitting or merging older ones.
Treat the new construction figure as a low estimate. HUD says other Census Bureau surveys suggest the CINCH technique significantly understates new construction as a share of all additions: the survey analysis counted 907,000 new homes of all kinds between 2019 and 2021, while the Census Bureau's construction survey reported 2,628,000 new homes completed in 2020 and 2021. Counting all units built from 2010 to 2021 instead, HUD's older method gives 1,349,000 new-construction rentals, which shows how much the figure depends on the method. For current construction counts, see the pages on apartments under construction and building permits.
New rentals tended to arrive at higher rents. Of the 2021 rentals HUD counts as new construction, about 69% fell in its three highest rent categories and about 16% in the three lowest and the non-market group, by our sums of HUD's counts. HUD sets those categories relative to local area median income, not fixed dollar amounts.
Which rent levels gained and lost?
Among the 42.5 million homes that were rentals in both years, 52% stayed in the same affordability category by our calculation. HUD counts 10.5 million that moved to a more affordable category and 9.7 million that moved to a less affordable one, a net of 736,000 toward more affordable categories. HUD's own same-category shares (48.4% and 45.3%) use different denominators. Because the categories move with local incomes, a unit can change category without its rent changing.
The table shows, for each of HUD's eight categories, how many 2019 rentals became owner-occupied or left the housing stock by 2021, and how many 2021 rentals in each category came from new construction. HUD does not publish sampling errors for these counts, so small differences between categories may not be meaningful.
| Affordability category (2019 for outflows, 2021 for new construction) | Rentals in 2019 | Became owner-occupied by 2021 | Lost from the housing stock by 2021 | 2021 rentals from new construction |
|---|---|---|---|---|
| Non-market (no cash rent or HUD-assisted) | 6,416,000 | 817,000 (12.7%) | 85,000 (1.3%) | 6,000 |
| Extremely low rent | 3,695,000 | 432,000 (11.7%) | 58,000 (1.6%) | 9,000 |
| Very low rent | 8,469,000 | 617,000 (7.3%) | 120,000 (1.4%) | 14,000 |
| Low rent | 7,086,000 | 433,000 (6.1%) | 84,000 (1.2%) | 13,000 |
| Moderate rent | 10,976,000 | 779,000 (7.1%) | 92,000 (0.8%) | 39,000 |
| High rent | 5,057,000 | 480,000 (9.5%) | 30,000 (0.6%) | 76,000 |
| Very high rent | 2,779,000 | 290,000 (10.4%) | 21,000 (0.8%) | 43,000 |
| Extremely high rent | 4,640,000 | 368,000 (7.9%) | 63,000 (1.4%) | 59,000 |
What this means for landlords
These are considerations to weigh against your own market, not recommendations.
- In 2019 to 2021, shifts between owning and renting moved more homes than construction or demolition did. Local rental supply can change as owners sell or rent out homes, which permit counts do not capture.
- Physical condition is one route out of the stock. HUD's temporary-loss categories include homes whose occupancy is prohibited and homes with interiors exposed to the elements, alongside conversions to business use.
- If your rentals are at lower or moderate rents relative to local incomes, HUD's figures suggest new construction added relatively few units at those levels nationally in 2019 to 2021. Local conditions can differ.
- For current supply, local permit and construction counts are more timely than these two-year national figures.
Methodology
The American Housing Survey, run by the Census Bureau for HUD, revisits the same sample of housing units every two years. HUD's contractors build special forward-looking weights, which follow the 2019 stock to 2021, and backward-looking weights, which trace the 2021 stock back to 2019. The CINCH report covers all housing; the Rental Dynamics report covers rentals and adds vacant units for rent using HUD's Housing Affordability Data System, which also assigns each unit to one of eight affordability categories.
Counts are HUD's, as published in the two reports' tables. Our own figures are shares of HUD's counts, sums across HUD's categories and rows, and two-year flows divided by two to give rough yearly figures; each is labelled as ours. The renter-occupied counts come from the CINCH report and the broader rental-stock counts from the Rental Dynamics report, so the two do not match.
Limitations
Read the numbers with these limits in mind.
- The latest national edition covers 2019 to 2021, a period that included the pandemic. HUD removed its 2017 to 2019 reports after finding a coding error and says it is working on corrected versions, and it says earlier editions are not comparable on new construction, so this page does not show a trend.
- HUD says other surveys suggest its method significantly understates new construction, so the 260,000 new rentals is likely a low estimate.
- In 2021, units were added to the survey's HUD-assisted oversample to make up for attrition since 2015. HUD's Rental Dynamics report excludes these 2.6 million units from its count of additions, as this page does. HUD's CINCH addition rate for renter-occupied homes (8.7%) includes them, so this page does not use it.
- The forward and backward weights do not agree exactly. HUD's adjustment between them was 3.7 million units for all housing, which the CINCH report calls substantially larger than in earlier editions, and 2.3 million for rentals.
- HUD's foreword says about 20% of renter-occupied units changed to owner-occupied; its appendix figure of 19.8% counts every 2019 renter-occupied home that was not renter-occupied in 2021, including those that became vacant or left the housing stock. In the Rental Dynamics tables, 8.6% of 2019 rentals became owner-occupied.
- HUD publishes no sampling errors for these counts, and it describes its z-score tests as indicative. Figures are national only.
- This page does not forecast rental supply.
Source: U.S. Department of Housing and Urban Development, Office of Policy Development and ResearchSource: U.S. Department of Housing and Urban Development, Office of Policy Development and ResearchSource: U.S. Department of Housing and Urban Development, Office of Policy Development and ResearchSource: U.S. Department of Housing and Urban Development, Office of Policy Development and Research
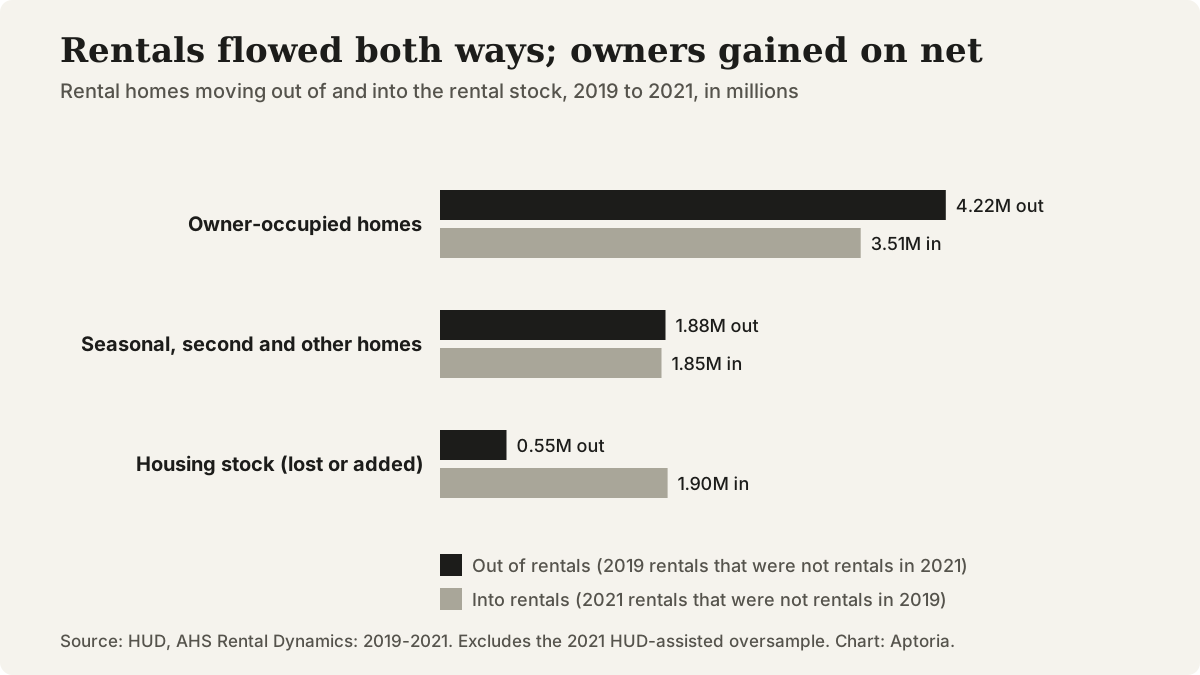
Rental homes moving out of and into the rental stock, 2019 to 2021, excluding the 2021 HUD-assisted sample addition. Source: HUD, American Housing Survey Rental Dynamics: 2019-2021.
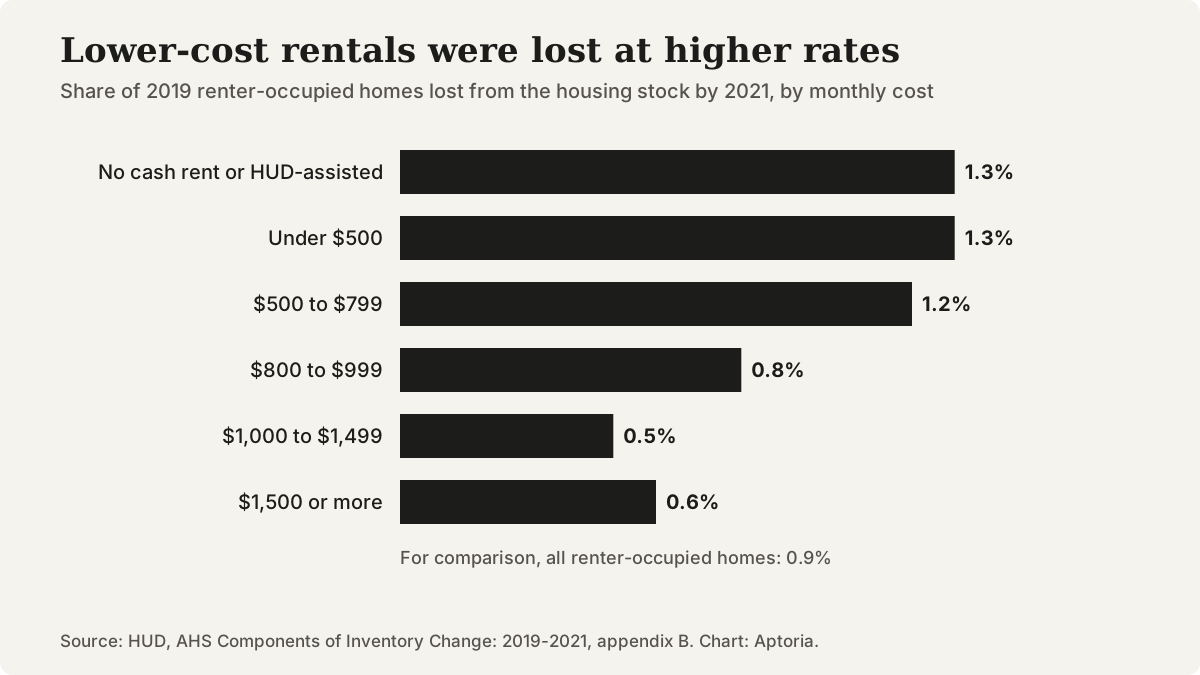
Loss rates of 2019 renter-occupied homes by 2021, by monthly housing cost. Source: HUD, American Housing Survey Components of Inventory Change: 2019-2021, appendix B.
Questions that come up
Does this page show how many apartments are being built?
No. HUD says other surveys suggest its survey-based method undercounts new construction, and the figures stop in 2021. Census Bureau permit, start and completion counts are the better guide to building activity, and the pages on apartments under construction and building permits cover them.
Does a rental that becomes owner-occupied count as a loss?
Not in HUD's housing stock accounting. The home is still housing, so HUD records a change in tenure. Only units that leave the housing stock, temporarily or permanently, count as losses.
Does this page cover years after 2021?
No. As of October 24, 2026, the 2019 to 2021 reports are the most recent edition on HUD's CINCH page, and its 2017 to 2019 reports are temporarily unavailable while HUD works on corrected versions.
Does this page cover my state or city?
No. The 2019 to 2021 reports are national. HUD has published metro-level CINCH reports for some areas in earlier years, but not for this period.
Sources and references
Follow each source to check the underlying claim. Access checks and professional review are different steps.